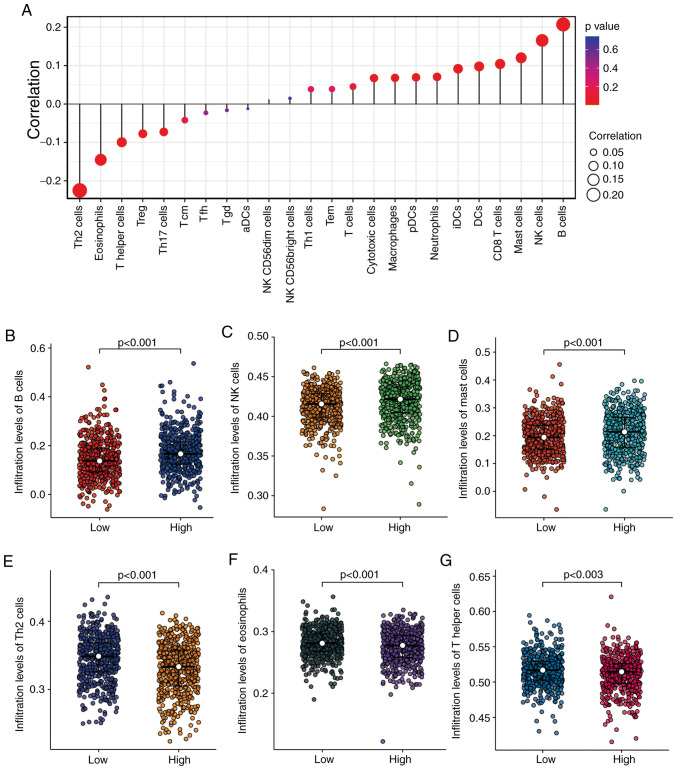
Figure 4.
Correlation analyses between KRT15 expression and immune-cell infiltration levels determined by ssGSEA in BRCA. (A) Correlation between the relative abundance of 24 immune cell types and gene expression levels. The dot size represents the correlation coefficients and the color represents the P-value. (B-G) Comparison of infiltration levels of different immune cell types between high and low KRT15 expression groups. The results are presented in scatter plots: (B) B cells, (C) NK cells, (D) mast cells, (E) Th2 cells, (F) eosinophils and (G) Th cells. BRCA, breast invasive carcinoma; KRT15, keratin 15; ssGSEA, single-sample gene set enrichment analysis; NK, natural killer; Th2, type 2 T-helper; Treg, T-regulatory cells; Tcm, central memory T cell; Tfh, follicular helper T cell; Tgd, T γδ cell; DCs, dendritic cells; aDCs, activated dendritic cells; pDCs, plasmacytoid dendritic cells; iDCs, immature dendritic cells; Tem, T effector memory.

