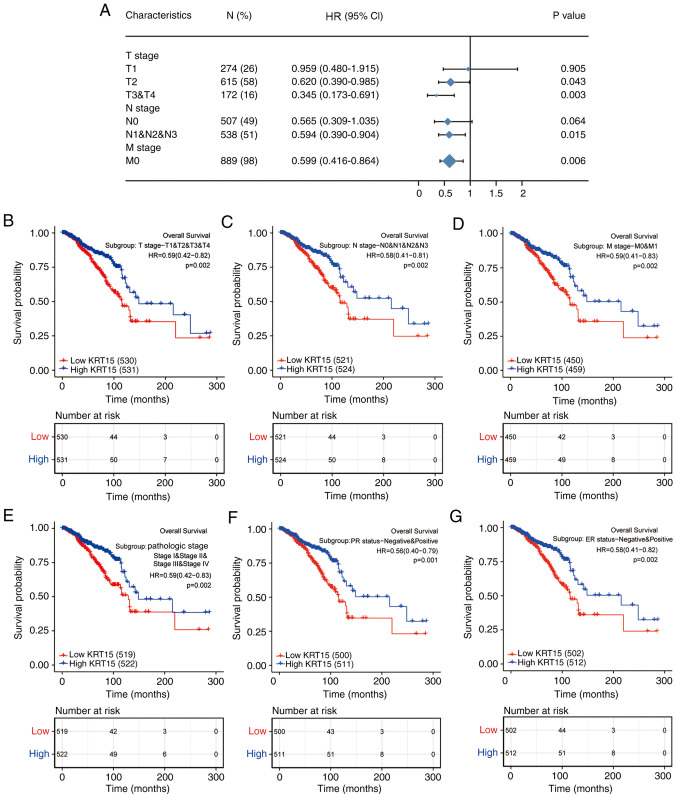
Figure 7.
Forest and KM plots for OS based on KRT15 expression in the different clinicopathological subgroups. (A) Forest plot of univariate Cox analysis on OS for different clinicopathological subgroups based on KRT15 expression in BRCA. (B-G) KM survival plots based on KRT15 expression in clinicopathological subgroups of patients with BRCA. (B) T1-4, (C) N0-3, (D) M0 and M1, (E) pathologic stages I-IV, (F) PR-negative and PR-positive and (G) ER-negative and ER-positive. HRs are presented with the 95% CI. KM, Kaplan-Meier; KRT15, keratin 15; OS, overall survival; BRCA, breast invasive carcinoma; PR, progesterone receptor; ER, estrogen receptor; HR, hazard ratio; CI, confidence interval.

