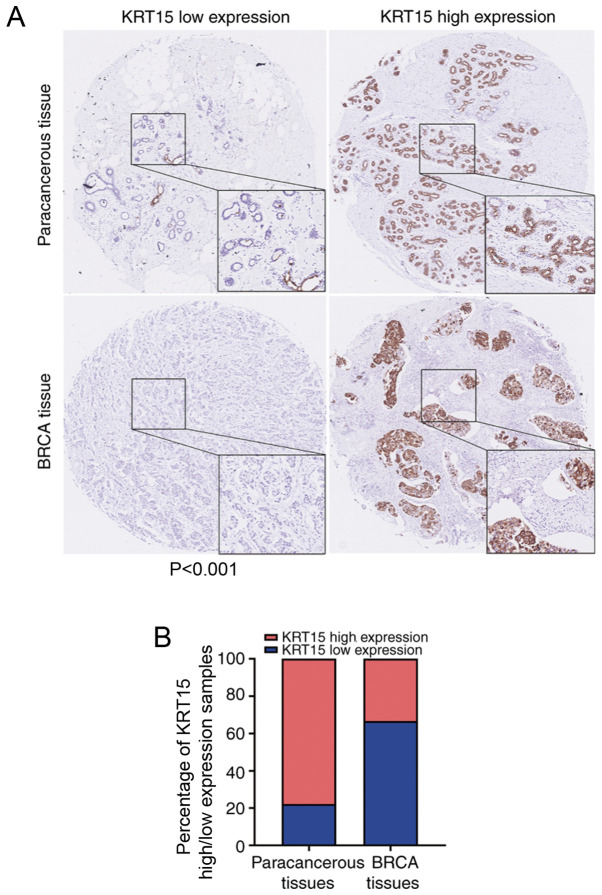
Figure 8.
Representative images of KRT15 expression in BRCA tissues and paracancerous tissues. (A) KRT15 low (top left image) or high expression (top right image) in paracancerous tissues. KRT15 low (bottom left image) or high expression (bottom right image) in BRCA tissues. Original magnification, x200 and x400 (magnified windows). (B) Histogram providing the percentage of KRT15 high/low expression samples in the BRCA tissue microarray. BRCA, breast invasive carcinoma; KRT15, keratin 15.

