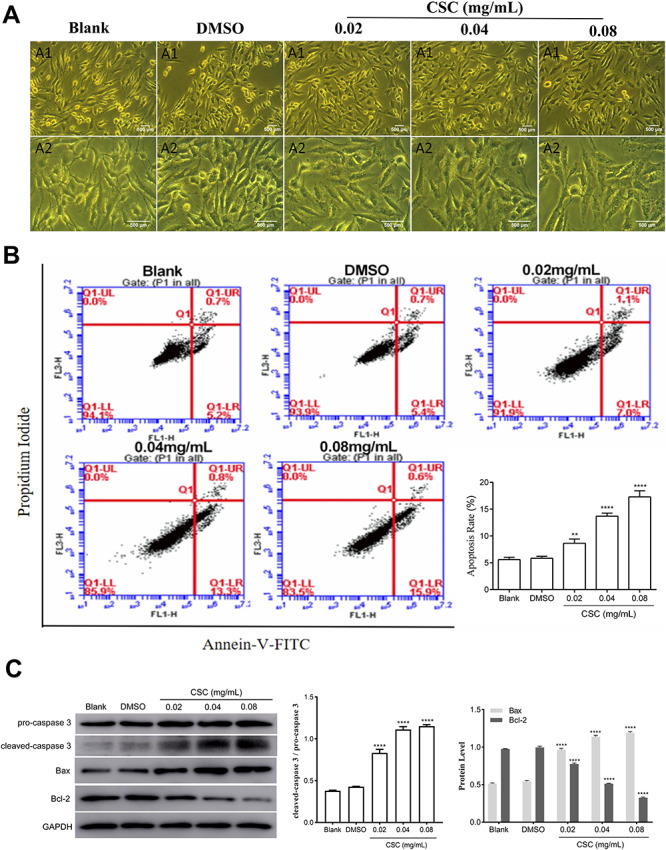
Figure 2.

CSC changed cell morphology and promoted cell apoptosis of BEAS-2B cells. (A) The changes in cell morphology were observed by utilizing inverted microscope. A1: cell morphology under 10 × 10 magnification; A2: cell morphology under 10 × 20 magnification. (B) Apoptosis was detected by flow cytometry. The values were presented as means ± SD of three independent experiments. (C) The expression levels of caspase 3, Bax and Bcl-2 were detected by western blot. Quantitative analysis of the proteins was performed. The values were presented as means ± SD of three independent experiments. *P < 0.05, **P < 0.01, ***P < 0.001 and ****P < 0.0001 indicated significant differences from the control (DMSO) group
