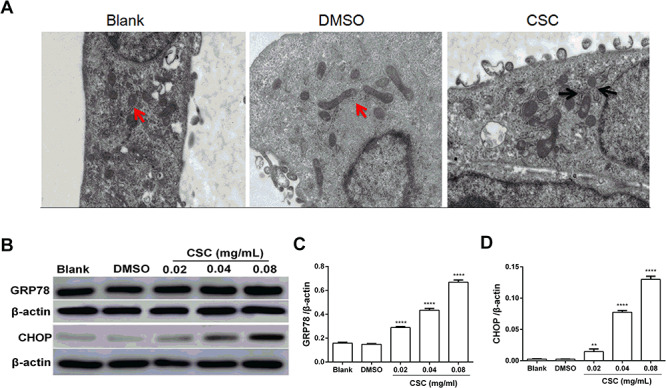
Figure 3.

CSC induced ERS in BEAS-2B cells. (A) BEAS-2B cells treated with 0.04 mg/ml CSC for 24 h were observed by TEM. The red arrow showed normal morphology of endoplasmic reticulum, and the black arrow showed swelling and dilation of the endoplasmic reticulum. (B) The expression levels of GRP78 and CHOP were detected by western blot. (C, D) Quantitative analysis of the proteins was performed. The values were presented as means ± SD of three independent experiments. *P < 0.05, **P < 0.01, ***P < 0.001 and ****P < 0.0001 indicated significant differences from the control (DMSO) group
