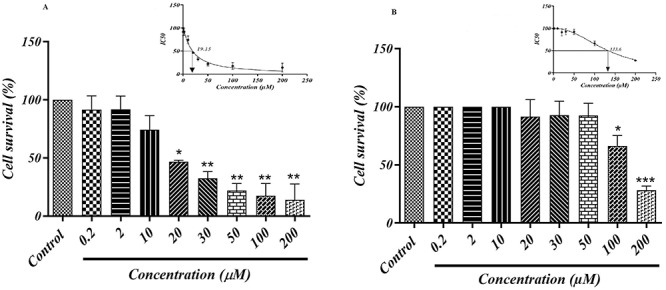
Figure 3.

MTT assay of (A) CP and (B) 4-HCH in HEK293 cells. Values are expressed as means ± SD from three independent experiments. *Significant difference compared to the control group (P < 0.05), **(P < 0.01) and ***(P < 0.001). IC50 value for each item was calculated with GraphPad prism software.
