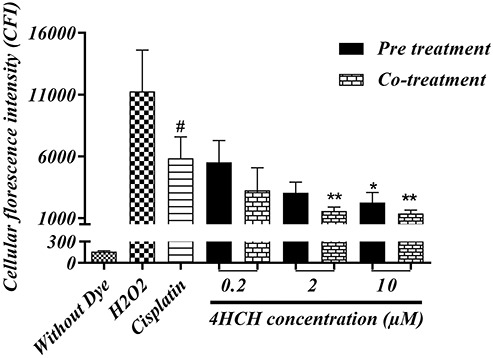
Figure 4.

HEK293 intracellular ROS measurement via 2′,7′-dichlorofluorescein diacetate dye. Cells were exposed to the H2O2 as a positive ROS inducer control. CP at an IC50 concentration (19.15 μM) was used in mentioned groups. All values are presented as mean ± SD from three independent experiments. *Significant difference compared to the CP (positive control) group (P < 0.05), **(P < 0.01). # CP group as compared to the normal cells **(P < 0.0001).
