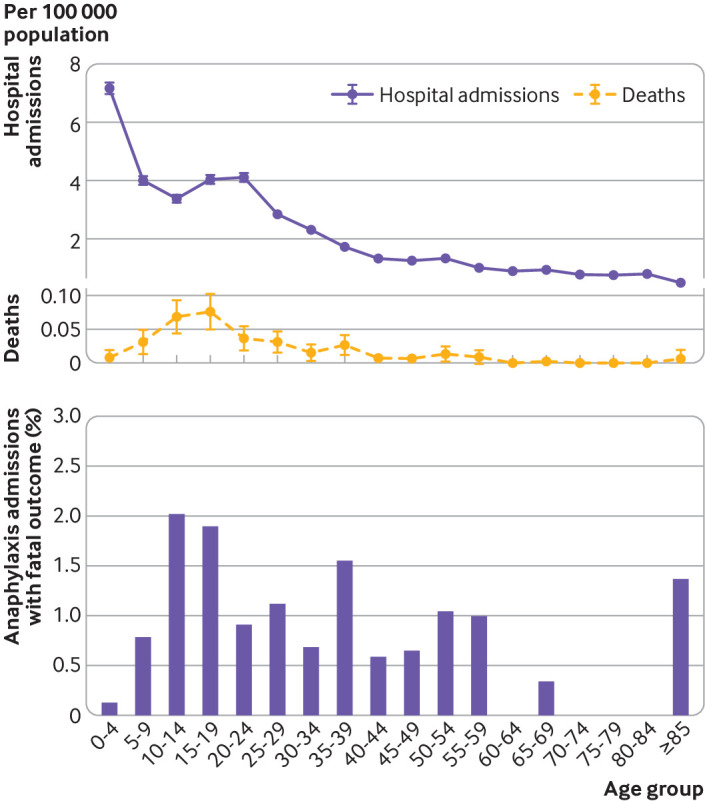
Fig 5.

Upper panel: hospital admissions and deaths due to food induced anaphylaxis by age group per 100 000 population, 1998-2018. Lower panel: case fatality rate for food induced anaphylaxis by age group, 1998-2018. Vertical bars represent standard error of the mean
