. 2020 Dec 17;12(3):880–895. doi: 10.1039/d0sc03175e

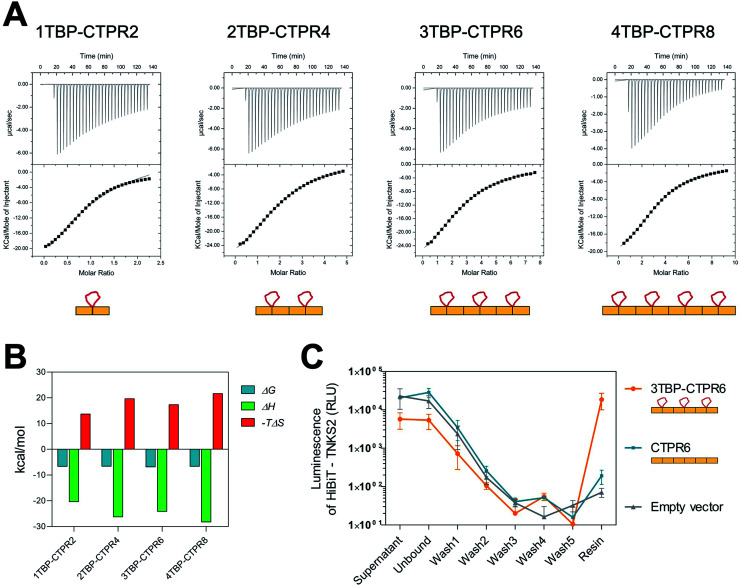
Fig. 2. Binding of TBP-CTPR proteins to hTNKS2 in vitro and in the cell. (A) Representative ITC traces from left to right: hTNKS2 ARC4 (500 μM) into 1TBP-CTPR2 (50 μM), hTNKS2 ARC4 (500 μM) into 2TBP-CTPR4 (25 μM), hTNKS2 ARC4 (500 μM) into 3TBP-CTPR6 (16.6 μM), hTNKS2 ARC4 (500 μM) into 4TBP-CTPR8 (12.5 μM); experiments were performed at 25 °C. The concentrations of nTBP-CTPR2n used were chosen so that the molar ratio between the number of TBP loops and TNKS2 ARC4 protein was constant. (B) Thermodynamic parameters (ΔG, ΔH and –TΔS) obtained by ITC for the binding of the four nTBP-CTPR2n proteins to hTNKS2 ARC4. For each parameter, the average from two independent experiments is plotted. (C) HiBiT-tagged hTNKS2 protein levels measured by luminescence intensity throughout each step of the HiBiT-qIP method. IP was performed in the presence of HA-tagged 3TBP-CTPR6, CTPR6 and an empty vector. Average values and standard deviation from two independent biological replicates are shown.

Fig. 2