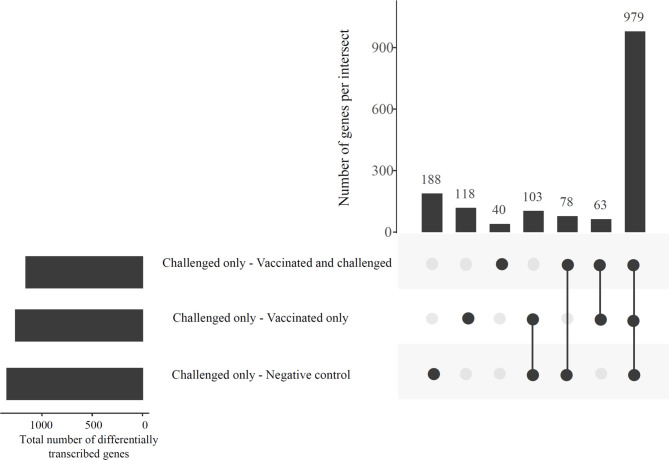
Figure 2.
An UpSetR plot displaying the abundances of common and unique significantly differentially transcribed genes in the challenged-only group compared to the negative control, vaccinated-and-challenged and vaccinated-only groups. Horizontal bars indicate the total number of differentially transcribed genes in each comparison.

