
Figure 1.
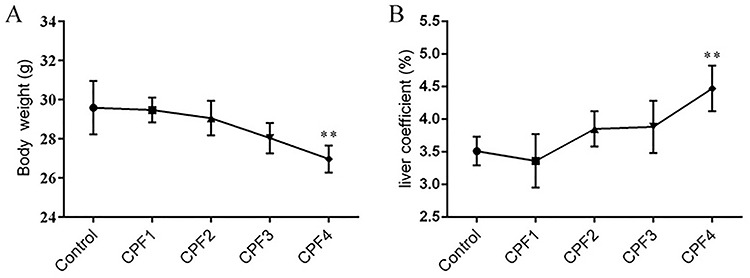
body weight (A) and the liver coefficient (B) of mice; each value is expressed as a mean ± SD, n = 10. *P < 0.05, **P < 0.01 vs. control (0 mg/kg).
Official websites use .gov
A
.gov website belongs to an official
government organization in the United States.
Secure .gov websites use HTTPS
A lock (
) or https:// means you've safely
connected to the .gov website. Share sensitive
information only on official, secure websites.
body weight (A) and the liver coefficient (B) of mice; each value is expressed as a mean ± SD, n = 10. *P < 0.05, **P < 0.01 vs. control (0 mg/kg).