
Figure 2.
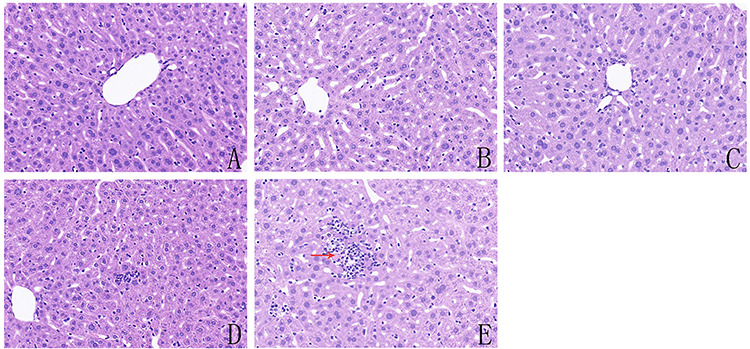
histological evaluation of the livers of mice from control and CPF-exposed groups: (A) mice from control group; (B) mice treated with 0.01 mg/kg CPF; (C) mice treated with 0.1 mg/kg CPF; (D) mice treated with 1 mg/kg CPF and (E) mice treated with 10 mg/kg CPF; the red arrows indicate necrotic hepatocytes, and the photomicrographs were taken at ×200 magnification after H&E staining, n = 4.