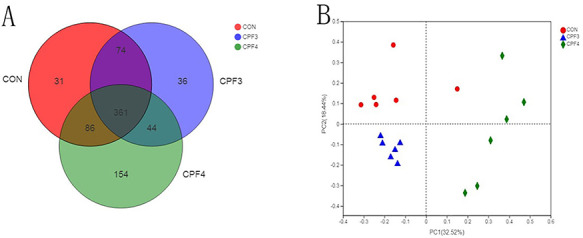
Figure 4.

effects of CPF on the gut microbiota composition of the fecal, n = 6; (A) Venn diagram of OTUs among each group, and each symbol represents one sample; (B) analysis of β diversity of intestinal flora in mice, and PCoA was performed to calculate the distances between fecal samples from the mice of control and CPF groups, and each point represents a sample. A clear separation is observed between the samples of control and CPF3 and CPF4 groups.
