
Figure 6.
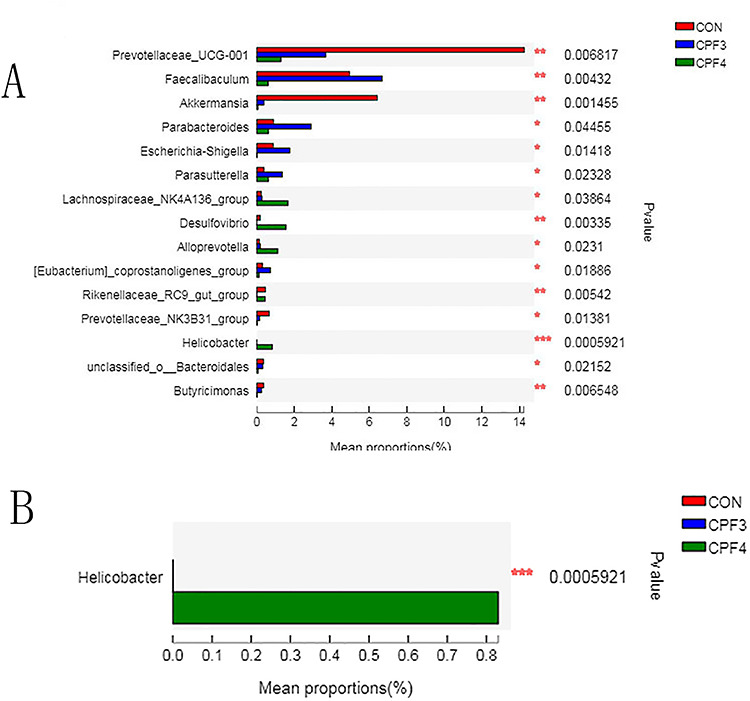
(A) significantly differences of the gut microbiota induced by CPF between CPF3, CPF4 and control groups at genus level; (B) significantly differences of Helicobacter induced by CPF between CPF3, CPF4 and control groups. Data were showed as relative abundance (%) of genus in each group, and statistical analysis was performed by the Kruskal–Wallis H test, n = 6, *P < 0.05, **P < 0.01, ***P < 0.001.