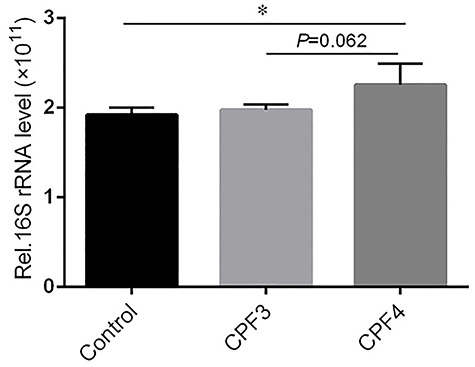
Figure 7.

the total bacterial load in the livers of mice from CPF3, CPF4 and control groups, and each value is expressed as a mean ± SD, n = 3, *P < 0.05, **P < 0.01.

the total bacterial load in the livers of mice from CPF3, CPF4 and control groups, and each value is expressed as a mean ± SD, n = 3, *P < 0.05, **P < 0.01.