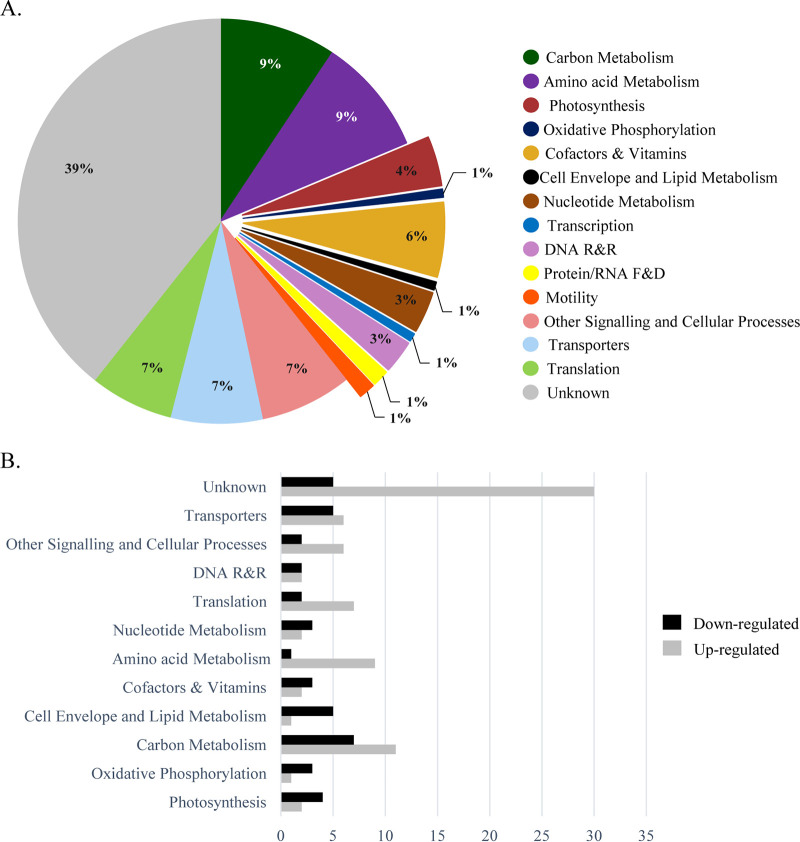
FIG 8.
Functional groups of proteins with significant fold changes in the Synechocystis kpsM mutant versus the wild type. (A) Distribution by functional category of the proteins identified and quantified by iTRAQ analysis. (B) Number of proteins by functional category with significantly higher or lower abundances in the kpsM mutant than in the wild type. See the annotated list of proteins in Table S4 in the supplemental material. Functional categories were assigned based on information available at the CyanoBase and KEGG databases.

