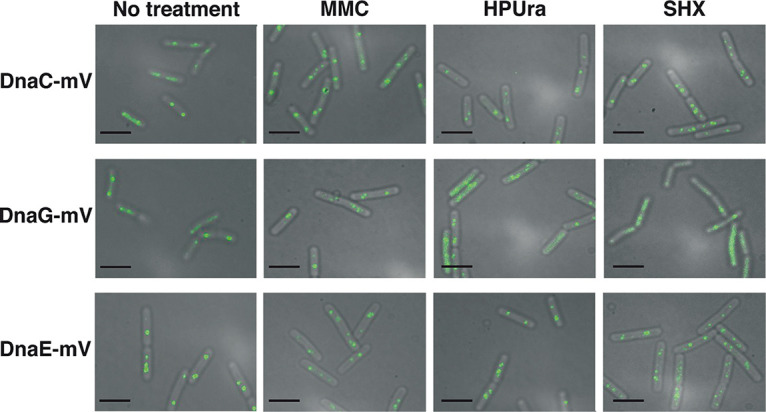
FIG 2.

Localization of DnaC-mVenus, DnaG-mVenus, and DnaE-mVenus during stress conditions. Epifluorescence microscopy of B. subtilis cells expressing DnaC-mV, DnaG-mV, or DnaE-mV as the sole source of the proteins treated with different drugs as indicated above the panel rows. Scale bars, 2 μm.
