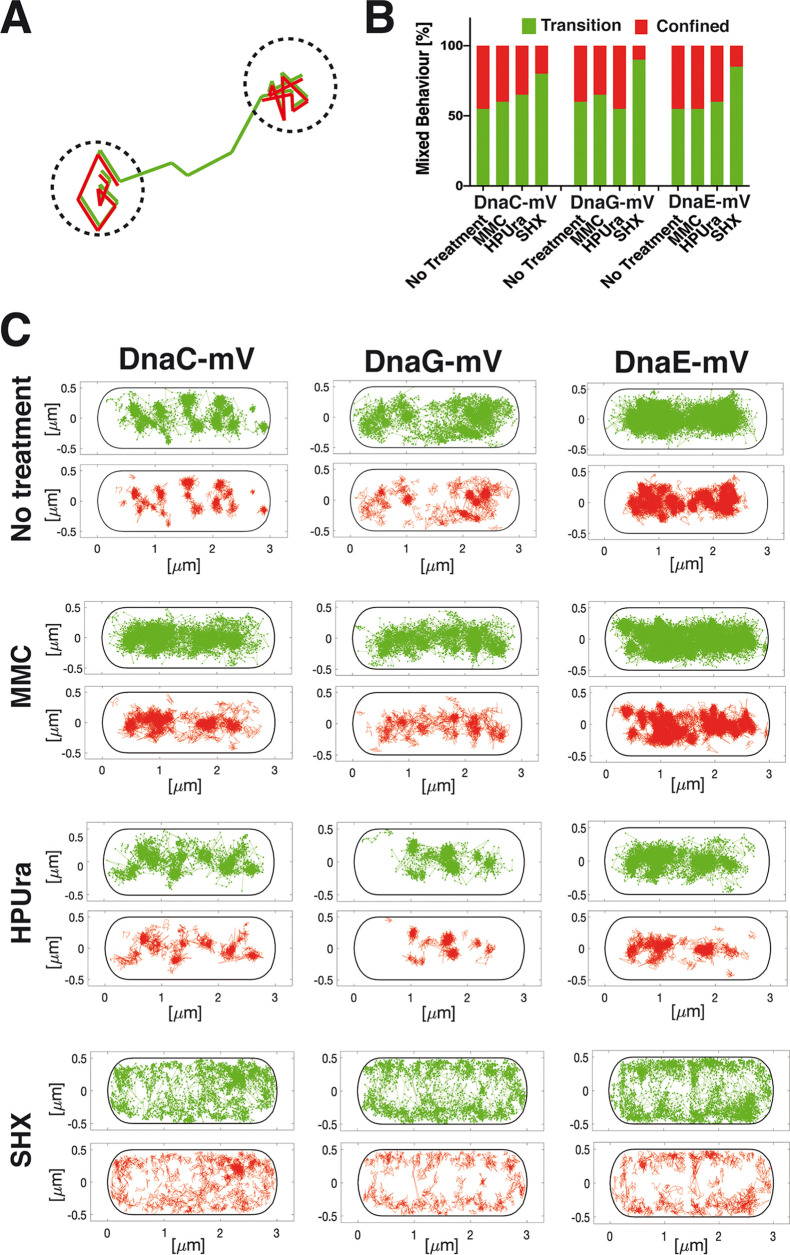
FIG 6.
Analyses of tracks for the percentage of transitions under stress conditions. (A) Cartoon showing the mode of analyses of confined movement (red) versus transition events (green). (B) Bar plot showing changes between confined and transitory motion for the three proteins under different stress conditions. (C) Maps showing intracellular location of confined motion (as defined by not leaving a radius of 120 nm for at least 9 steps) and transition events for DnaC-mVenus, DnaG-mVenus, and DnaE-mVenus, projected into a standardized cell 3 by 1 μm in size.

