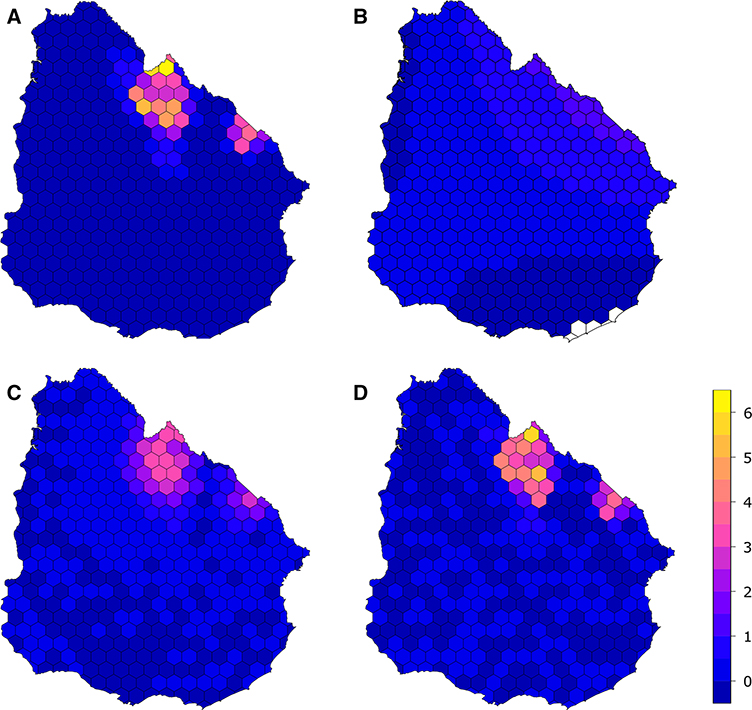
Figure 3.
Measured and estimated rabies density: a Calculated density of ranches with rabies cases in the regular grid, from the data from official veterinary services. b Distribution of fitted values from the linear regression showing a northeast-to-southwest trend on the density of ranches with rabies cases. There are higher expected densities in the northeastern region of the country and decreasing values in the northeast-to-southwest direction (see also Figure S5 for an enhanced color scale for these predicted values). c Predicted density of ranches with rabies cases in the regular grid, combining the predictions of the simultaneous autoregressive model and the linear model. d Predicted density of ranches with rabies cases in the regular grid, combining the predictions of the Geographically Weighted Regression and the Linear model. Color scale is the same for the four maps.

