Fig. 1.
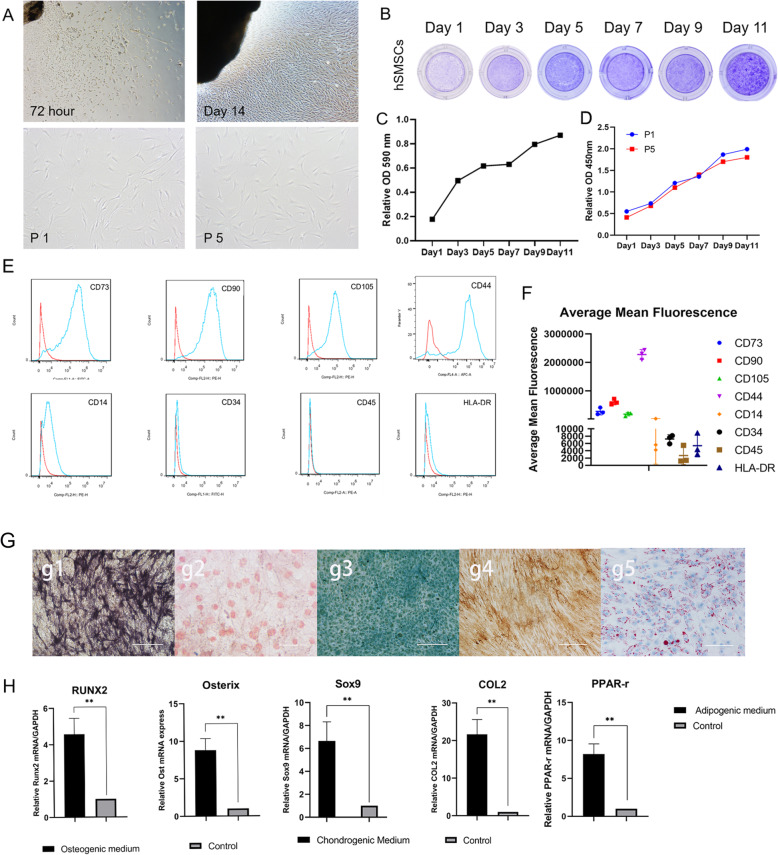
Isolation and morphology of cultured hSMSCs; the proliferation potential and the identification of hSMSCs. a hSMSCs were migrated outwards from the freshly harvested synovium at 72 h; Morphology of the confluence hSMSCs was recorded at day 14; primary cultures (P0) and the fifth passage (P5) with spindle shapes on cell culture dish (original magnification × 40, scale bar =200 μm) b. Cell proliferation assessed by crystal violet staining assay. General observation of the stained cells was recorded at the indicated time-points. c The stained cells were dissolved for quantitatively OD reading at A590 nm. d Proliferation of P1 and P5 as determined by the CCK-8 method showed that no significant difference. e The MSC markers of hSMSCs at P1 by flow cytometry and hSMSCs were positive for the MSC markers CD73, CD90, CD105, and CD44, while weakly expressed the markers CD34, CD14, CD45, and HLA-DR. f The average mean fluorescence for all markers between three donor populations. g The potential for osteogenic, chondrogenic, and adipogenic differentiation of hSMSCs in vitro: osteogenic (g1.alkaline phosphatase staining and g2.Alzarin Red S staining), chondrogenic (g3.Alcian Blue staining and g4.COL 2 immunohistochemical staining), and adipogenic (g5.Oil Red O staining) (original magnification × 200, scale bar = 50 μm). h RT-qPCR assay was performed to determine that the expression of osteogenic chondrogenic and adipogenic differentiation relative factors, including RUNX2, Osterix, Sox9, COL2, and PPAR-γ. The data are shown as mean ± SD for three separate experiments. *P < 0.05, **P < 0.01

