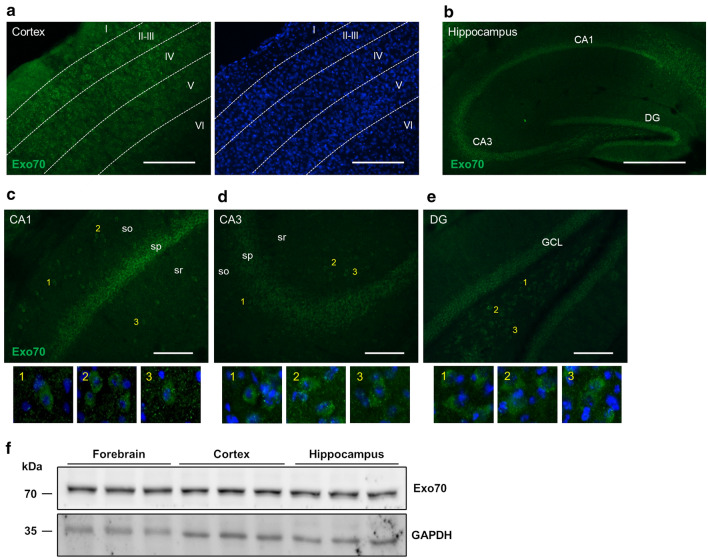
Fig. 1.
Evaluation of Exo70 expression in the brain, cortex, and hippocampus. Two-month-old male mice were perfused and 30 µm thick brain slices were prepared. a, b Representative images of slices obtained between 1.8 and 2 mm caudal from bregma. Slices were stained with an Exo70 specific polyclonal antibody and Hoechst to label the nucleus. Cortical layers and hippocampal zones are depicted in the images. Scale bars: cortex 300 µm, hippocampus 400 µm. c, d, e Hippocampal zones CA1, CA3, and DG are shown. so: Stratum oriens; sp: Stratum pyramidale; sr: Stratum radiatum. Scale bars: 100 µm. f Western blot analysis of brain, cortex, and hippocampus protein extracts. Samples were resolved in 10% SDS-PAGE. 30 µg of protein samples were loaded in each well. n = 3 mice per group

