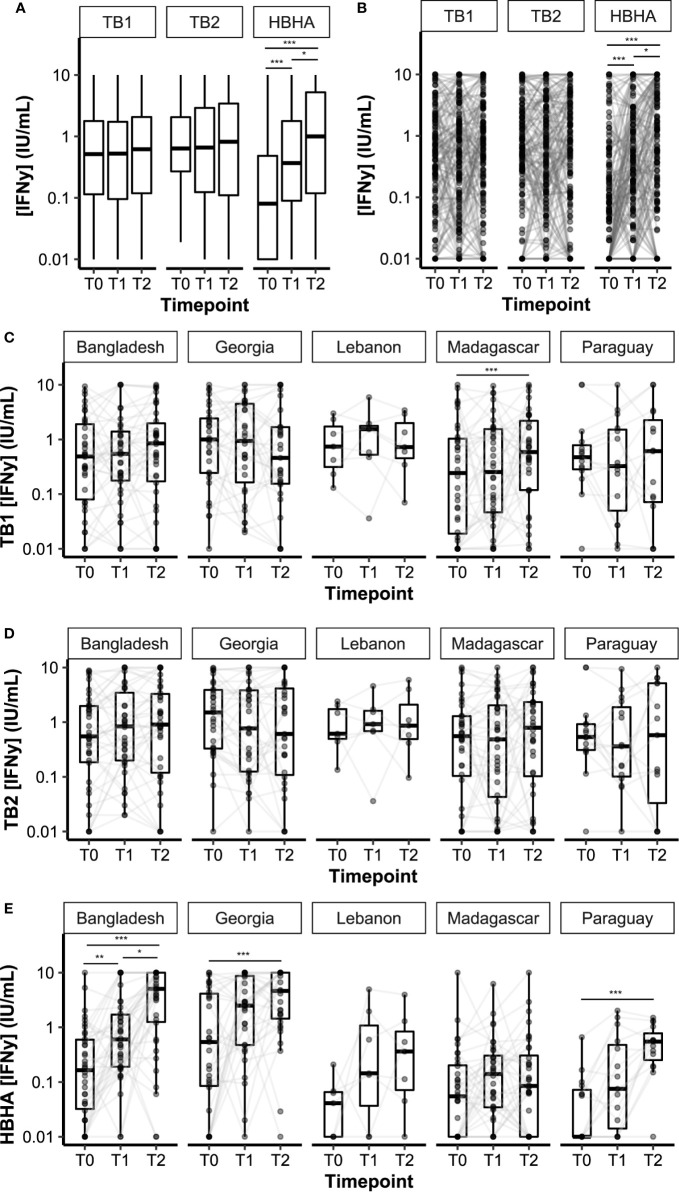
Figure 2.
Dynamics of plasma IFN-γ response to QFT-P and HBHA stimulations over the course of TB therapy. Data are given as median + interquartile range. Each black dot represents one patient at one timepoint. Grey lines connect data points from the same patient. (A) Median IFN-γ responses in the complete cohort (n = 132 per timepoint). (B) Individual IFN-γ responses in the complete cohort. (C–E) Stratification per study site. Bangladesh (n = 38), Georgia (n = 31), Lebanon (n = 7), Madagascar (n = 36), Paraguay (n = 20). T0: baseline. T1: baseline + 2 months. T2: end of treatment. Data were compared using Friedman’s Exact Test with the Wilcoxon–Nemenyi–McDonald-Thompson post-hoc, or the Mann–Whitney U test (B). *p < 0.05; **p < 0.01; ***p < 0.001.

