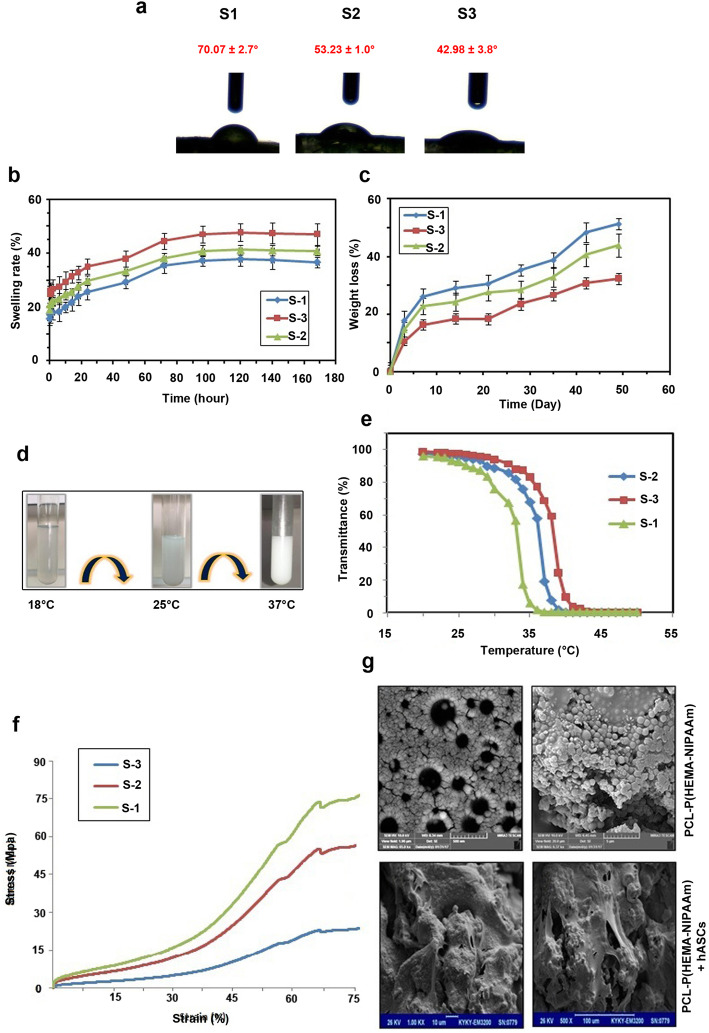
Fig. 3.
Measuring S-1, S-2, and S-3 water contact angle (a). Equilibrium swelling ratios and swelling profiles of the PCL-P(HEMA-NIPAAm) hydrogels with different concentrations of CL and HEMA (S-1, S-2, S-3) as a function of time at pH = 7.4 and 37 °C (n = 3) (b). In vitro hydrolytic degradation profiles of the PCL-P(HEMA-NIPAAm) hydrogels with different concentrations of CL and HEMA (S-1, S-2, S-3) as a function of time in PBS at 37 °C (n = 3) (c). Macroscopic phase separation of an aqueous solution of the PCL-P(HEMA-NIPAAm) S-2 hydrogel under different conditions (d). Transmittance-temperature curves of the PCL-P(HEMA-NIPAAm) hydrogels (e). Compressive stress-strain curve of the PCL-P(HEMA-NIPAAm) all hydrogels. Data showed that S-2 exhbits moderate compressive strength, Young’s modulus, and compressive strain (%) compared to the S-1 and S-3. FESEM micrographs of the architecture of the PCL-P(HEMA-NIPAAm) S-2 hydrogel surface (g). Observation of the cell morphology, attachment, and spreading of hASCs on the PCL-P(HEMA-NIPAAm) S-2 hydrogel after 7 days of culture through SEM

