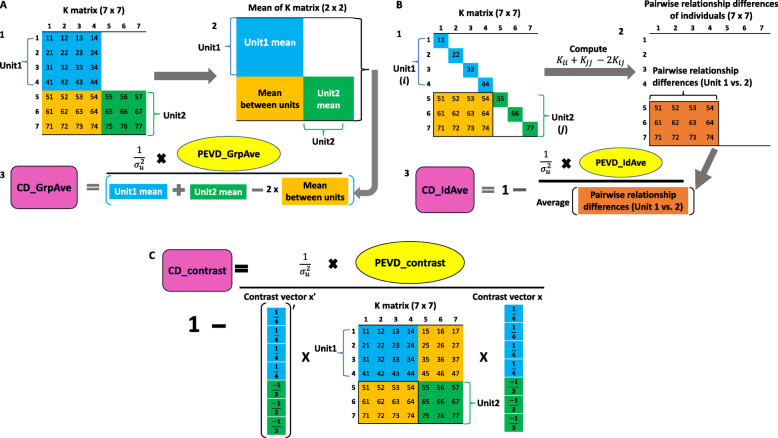
Fig. 3.
A flow diagram of three coefficient of determination (CD) statistics. The group average CD (CD_GrpAve) is shown in A. A1: A relationship matrix of seven individuals. A2: Calculate the mean relationships within and between units. A3: Group average CD is calculated by scaling group average PEVD (PEVD_GrpAve) by the quantity obtained from the PEVD equation using the within and between unit means. The individual average CD (CD_IdAve) is shown in B. B1: A relationship matrix of seven individuals. B2: Calculate pairwise relationship differences of individuals between the units. Subscripts i and j refer to the ith and jth individuals in units 1 and 2, respectively. B3: Individual average CD is calculated by scaling indvidual average PEVD (PEVD_IdAve) with the average of pairwise relationship differences of individuals. The CD of contrast (CD_Contrast) is shown in C. CD_Contrast is calculated by scaling the prediction error variance of the differences (PEVD) of contrast with the product of the transpose of the contrast vector (x), the relationship matrix (K), and the contrast vector

