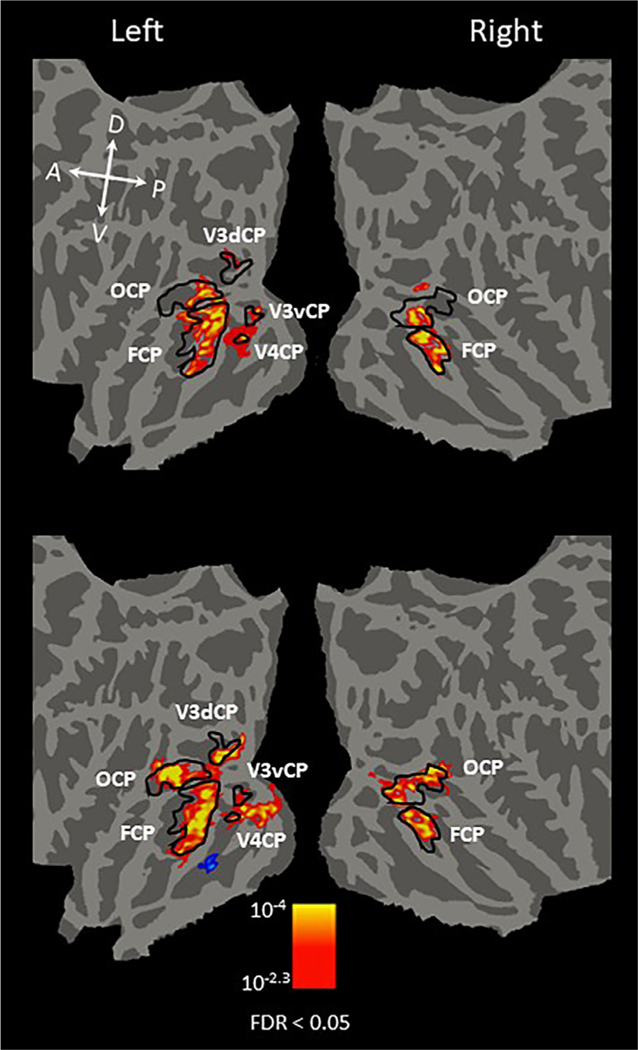
Fig. 5.
Comparison of group-averaged cortical maps of regions with significant curvature response preference across stimulus type (conditions 1 and 2 vs. conditions 3 and 4). Group-averaged maps were projected onto the FreeSurfer averaged flattened brain. The map on the top was generated using the fMRI activity contrast of round > rectilinear real-world objects. The map on the bottom was generated using the fMRI activity contrast of computer-generated 3D sphere array > computer-generated 3D pyramid array. Yellow/red activation indicates the curvature response preference; blue/cyan indicates the rectilinear response preference. Black outlines indicate the boundaries of the curvature-preferring patches. As expected, because the image size of the computer-generated stimuli was larger than that of the real-world objects, we observed more early visual areas activated by the computer-generated stimuli (top) than real-world objects (bottom). However, all curvature-preferring regions observed in the combined map (Fig. 4) are present in the separated maps, indicating the consistency of curvature preference regions across stimulus type. The corrected statistical threshold was FDR < 0.05. Local orientations of the brain axes on the flattened brain are indicated in white letters (D = dorsal; V = ventral; P = posterior; A = anterior).

