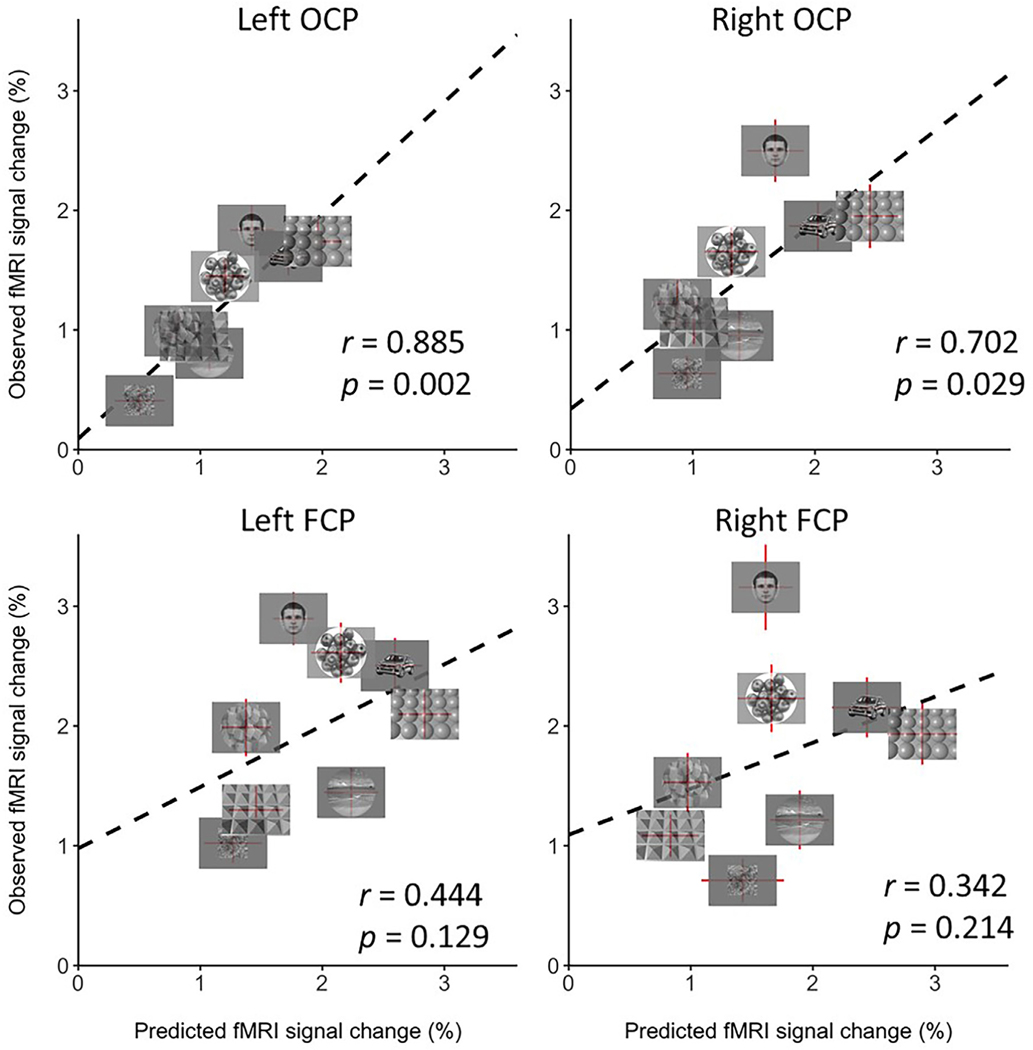
Fig. 7.
Correlation of the predicted fMRI response from the linear combination of curvature values with fMRI activity in OCP and FCP. The correlation is significant in left and in right OCP (left OCP, r = 0.885, p = 0.002; right OCP, r = 0.702; p = 0.029), but not in left and right FCP (left FCP, r = 0.444, p = 0.129; right FCP, r = 0.342, p = 0.214), suggesting that OCP plays a role in processing complex curvilinear information derived from simple curvilinear information (such as curved lines).

