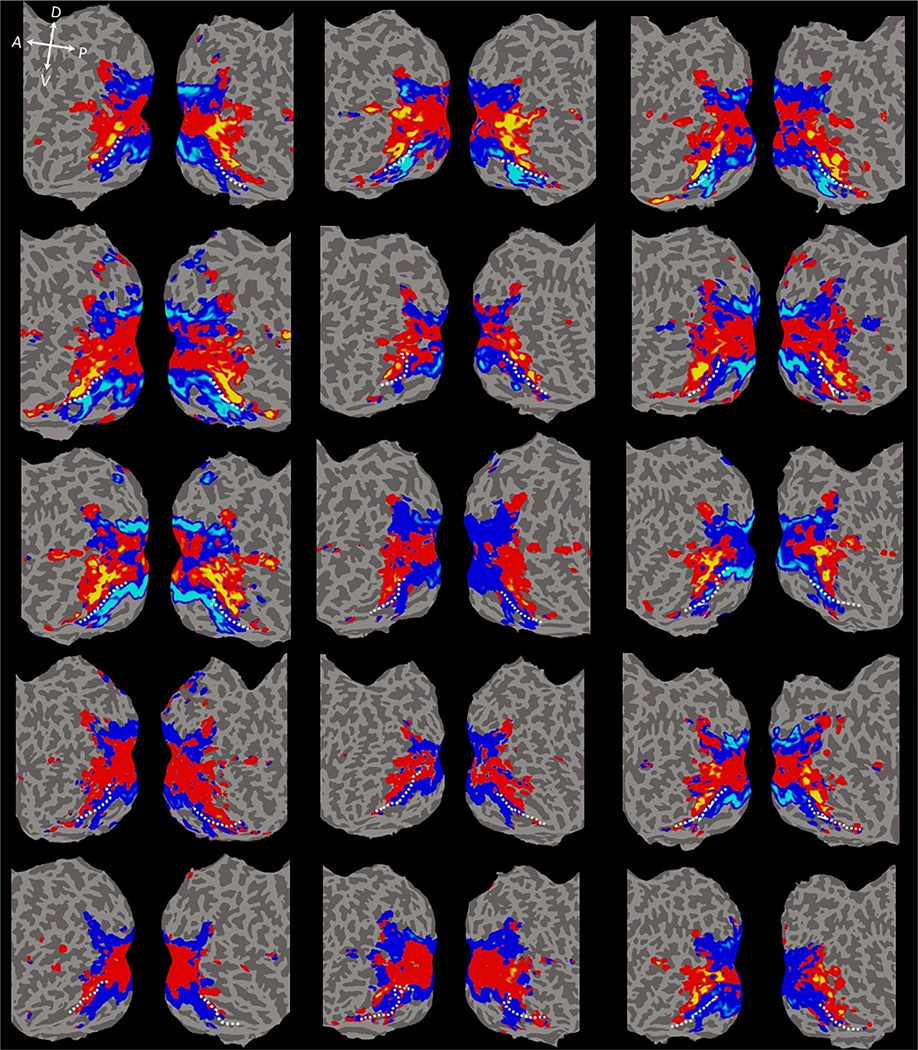
Fig. 9.

Individual subject PCA maps. Each subject’s data (N = 15) were projected onto their native flattened surface. Relatively consistent across all subjects, the visual cortex associated with positive PC2 values was confined within the central visual field in the early visual areas, and then extended continuously to the anterior temporal lobe through lateral occipitotemporal areas. Regions of visual cortex associated with negative PC2 values extended from peripheral visual field representations in early visual areas to the medial surface of the occipitotemporal cortex and then to the collateral sulcus (CoS) and parahippocampal gyrus. The dashed white line indicates the anatomical border between the fusiform gyrus and the collateral sulcus. Local orientation of the brain axes on the flattened brain are indicated in white letter (D = dorsal; V = ventral; P = posterior; A = anterior).
