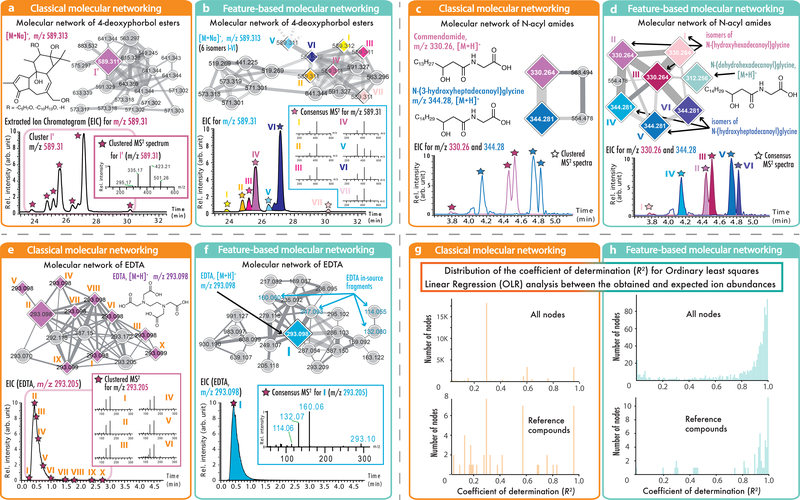
Fig. 2: Comparisons of classical MN and FBMN.
In these examples, the node size corresponds to the relative spectral count in classical MN (orange boxes, left) or to the sum of LC-MS peak area in FBMN (blue boxes, right); diamond shape nodes are spectra annotated by spectral library matching; the edge color gradient indicates the spectral similarity degree (the lighther the less similar). (a) displays the results from classical MN with the LC-MS2 data of Euphorbia dendroides plant samples (n = 1 LC-MS2 experiment per sample); classical MN resulted in one node for the ion at m/z 589.313, while (b) FBMN was able to detect seven isomers. (c) Classical MN with the data from the American Gut Project (n = 1 LC-MS2 experiment per sample) showed two different N-acyl amides while the use of FBMN (d) allowed the annotation of three different isomers per N-acyl amides. Classical MN (e) and FBMN (f) were used to analyse the network of EDTA in plasma (373 samples, n = 1 LC-MS2 experiment per sample). By merging MS2 spectra of EDTA eluting over 2.5 min into one best-quality MS2 spectrum, FBMN recovered the molecular similarity of in-source fragments observed for EDTA. (g and h) Evaluation of quantitative performance using multiple dilutions of a reference serum sample (3 LC-MS2 experiments per sample). The plots (g and h) are showing the distribution of the coefficient of determination (R2) from the Ordinary least squares Linear Regression (OLR) analysis between the observed and expected relative ion abundance for molecular network nodes in classical MN (g) or in FBMN (h). The upper charts present the distribution of the R2 for the network nodes with classical MN (n = 3,367) and FBMN (n = 877), and the bottom charts show the R2 distribution from the OLR analysis for the annotated reference compounds with classical MN (n = 49) and FBMN (n = 54). While classical MN uses the clustered MS2 spectral count or the sum of the precursor ions to estimate the molecular network node abundance, FBMN uses the LC-MS feature abundance (peak area or height), resulting in a more accurate estimation of the relative ion intensity.

