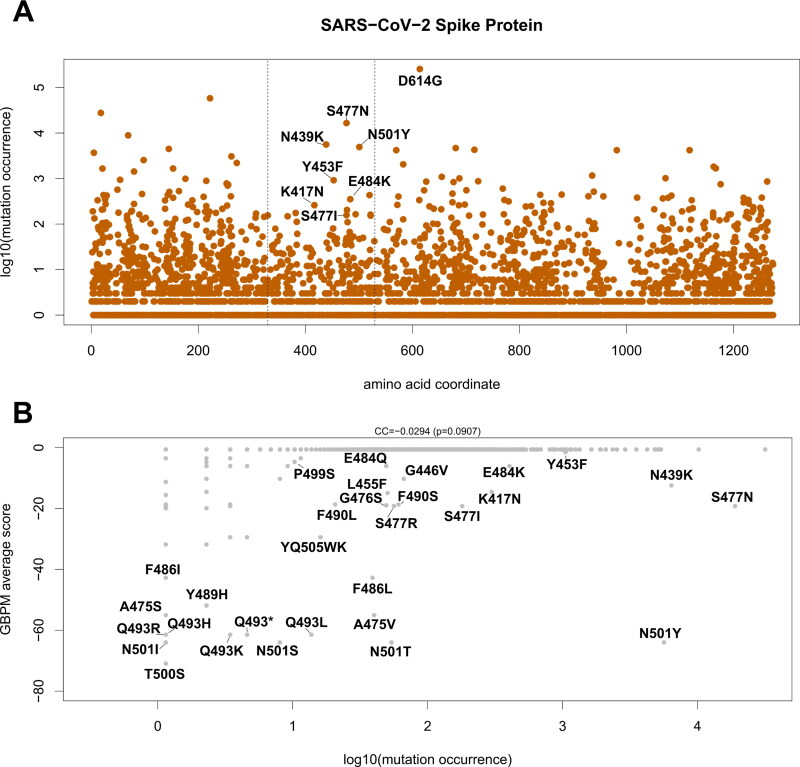
Figure 4.
(A) Occurrence of AA-changing variants on SARS-CoV-2 Spike protein. X-axis indicates the position of the affected AA. Y-axis indicates the log10 of the number of occurrences of the variant in the SARS-CoV-2 dataset. Labels indicate variants affecting ACE2/Spike binding and detected in at least five SARS-CoV-2 sequences. Vertical dashed lines indicate crystalized region analyzed (aa 330 – 530). The D614G variant, located outside the RBD, is also indicated. (B) Scatter plot indicating the occurrence of the variant in the population (x-axis) and the GBPM score of the reference AA in the model (y-axis). Mutations with non-zero GBPM score are indicated. CC indicates the Pearson correlation coefficient and p indicates the p-value of the CC.

