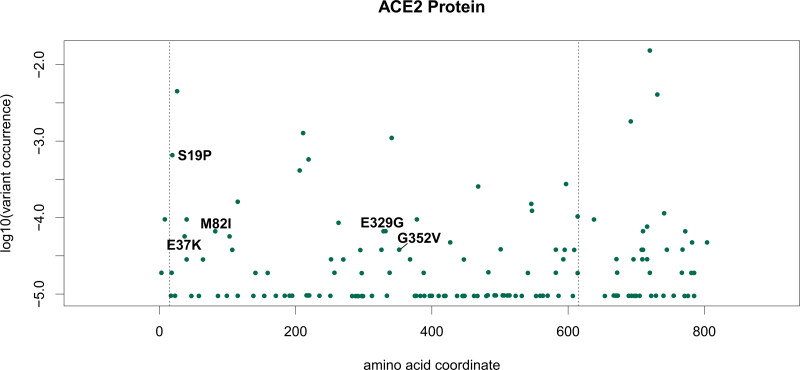
Figure 5.
Frequency of mutations on ACE2. X-axis indicates the AA position in isoform 1 (UniProt id Q9BYF1-1). Y-axis indicates the allele frequency in the global population according to the GNOMAD v3 database. Labels indicate AA changes observed in the human population with non-zero GBPM average score in the ACE2/Spike interaction models. Vertical dashed lines indicate the crystalized region analyzed in this study (aa 15 – 615).

