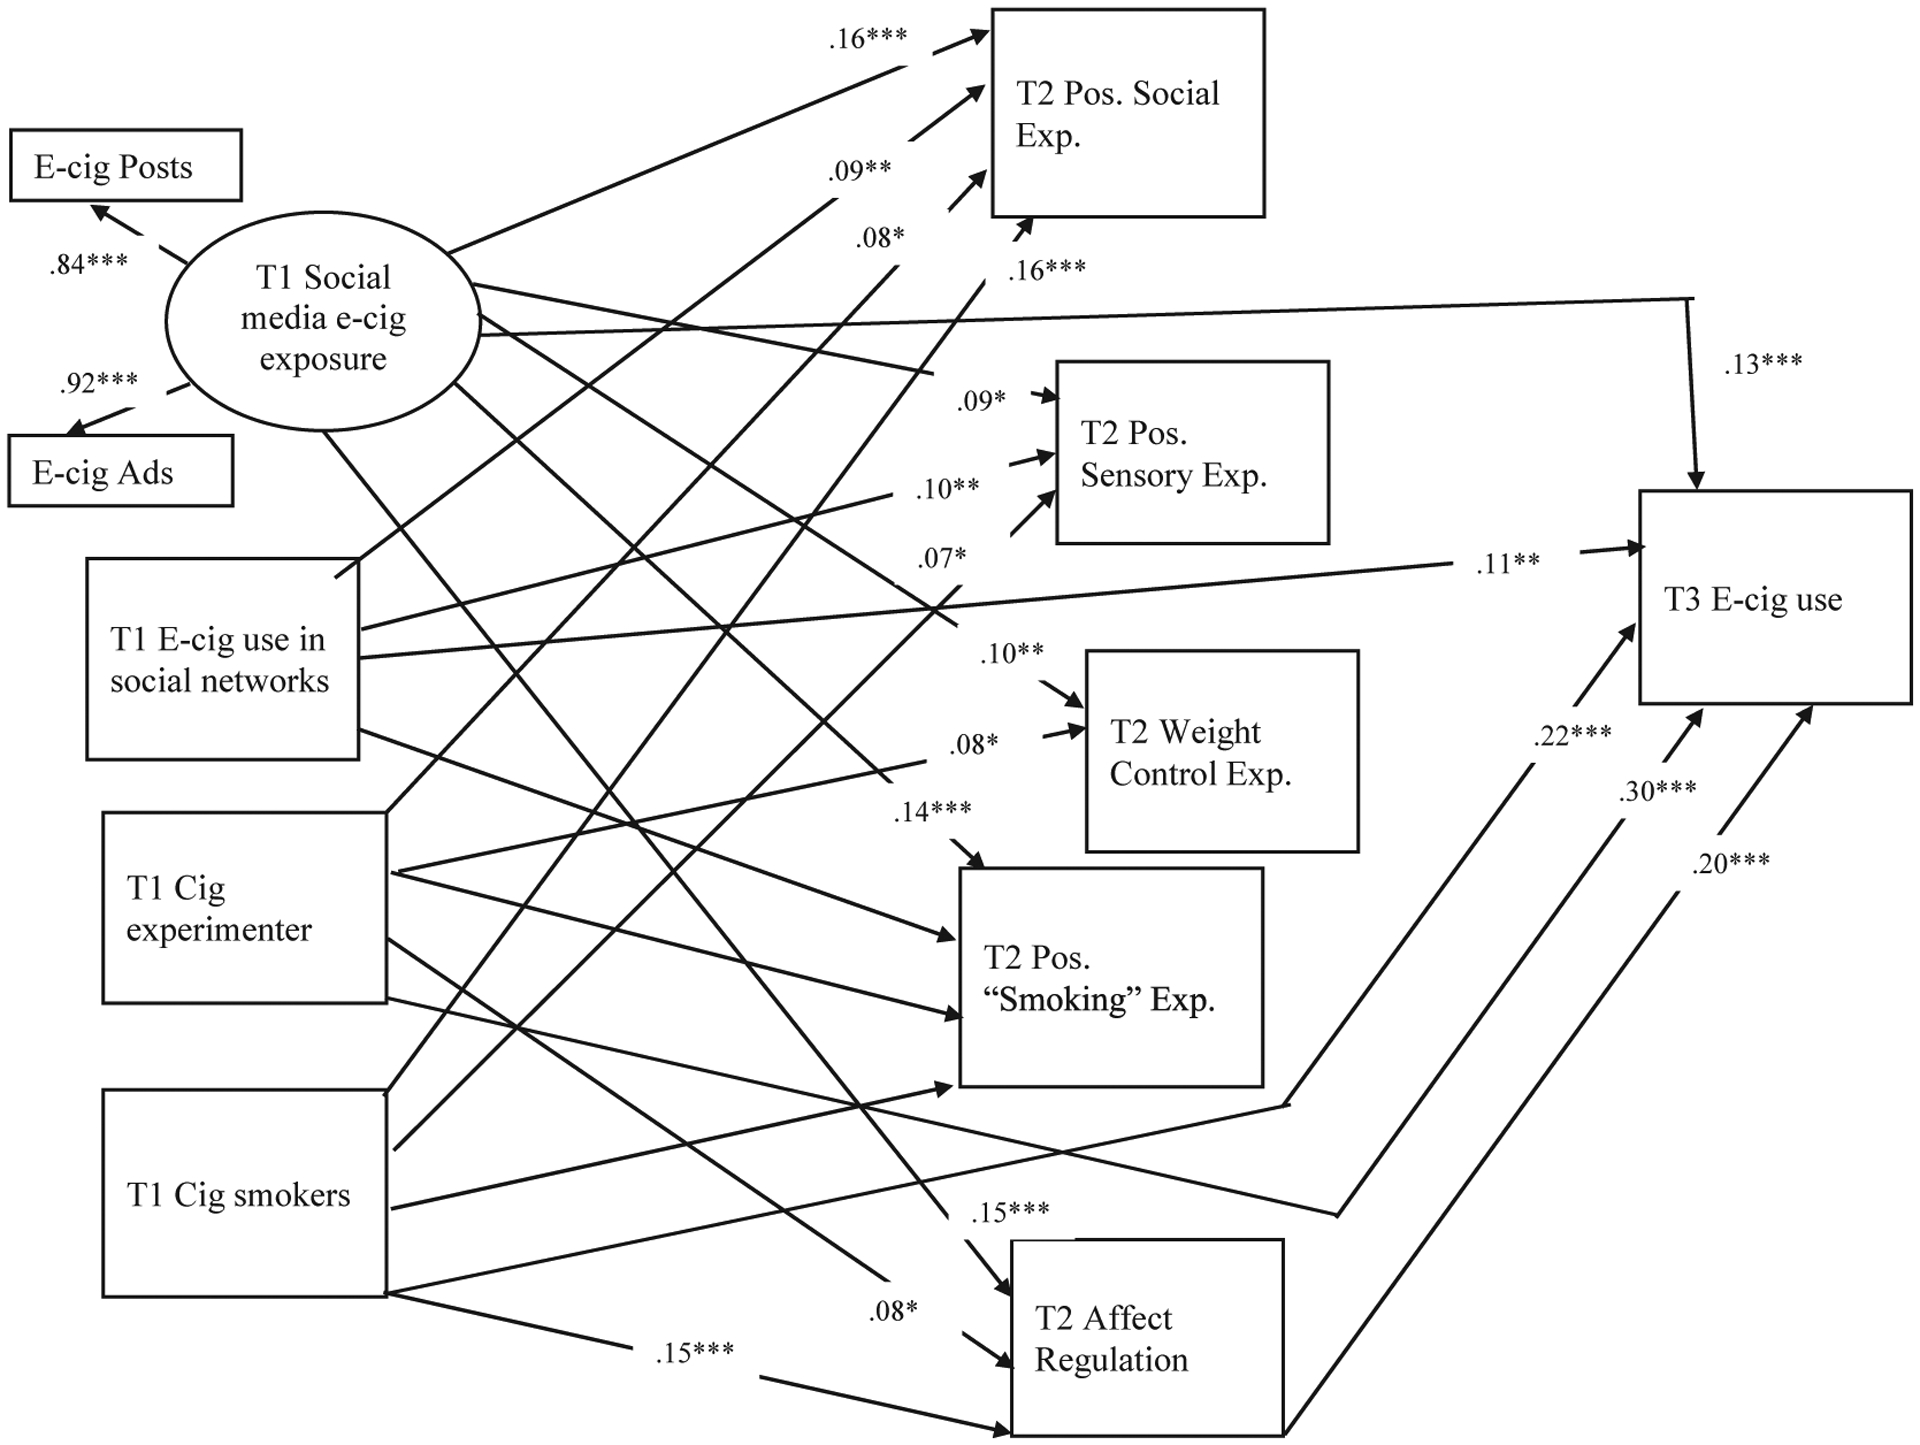
Fig. 1.

Structural equation model showing the associations among social media e-cigarette exposure at baseline (T1), positive e-cigarette use outcome expectancies at six-month follow-up (T2), and evere-cigarette use at one-year follow up (T3) among e-cigarette never-users at baseline. E-cig = Electronic (e)-cigarette; Cig = Cigarette; Pos. = Positive. The model adjusted for, but does not show, the following demographic variables: age, sex, ethnicity (Asian, Native Hawaiian/Pacific Islander, Filipino, and Other dummy-coded with White as the reference group), family/household income, and college type (two-year vs. four-year). Circles represent latent variables and rectangles represent manifest variables. Arrows represent regression paths. Numbers represent standardized factor loadings or path coefficients. Only statistically significant paths are shown. All exogenous variables were correlated with each other. Co-variances between mediators were included in the model but are not shown in the figure. *** = p < .001, ** = p < .01, *p < .05.
