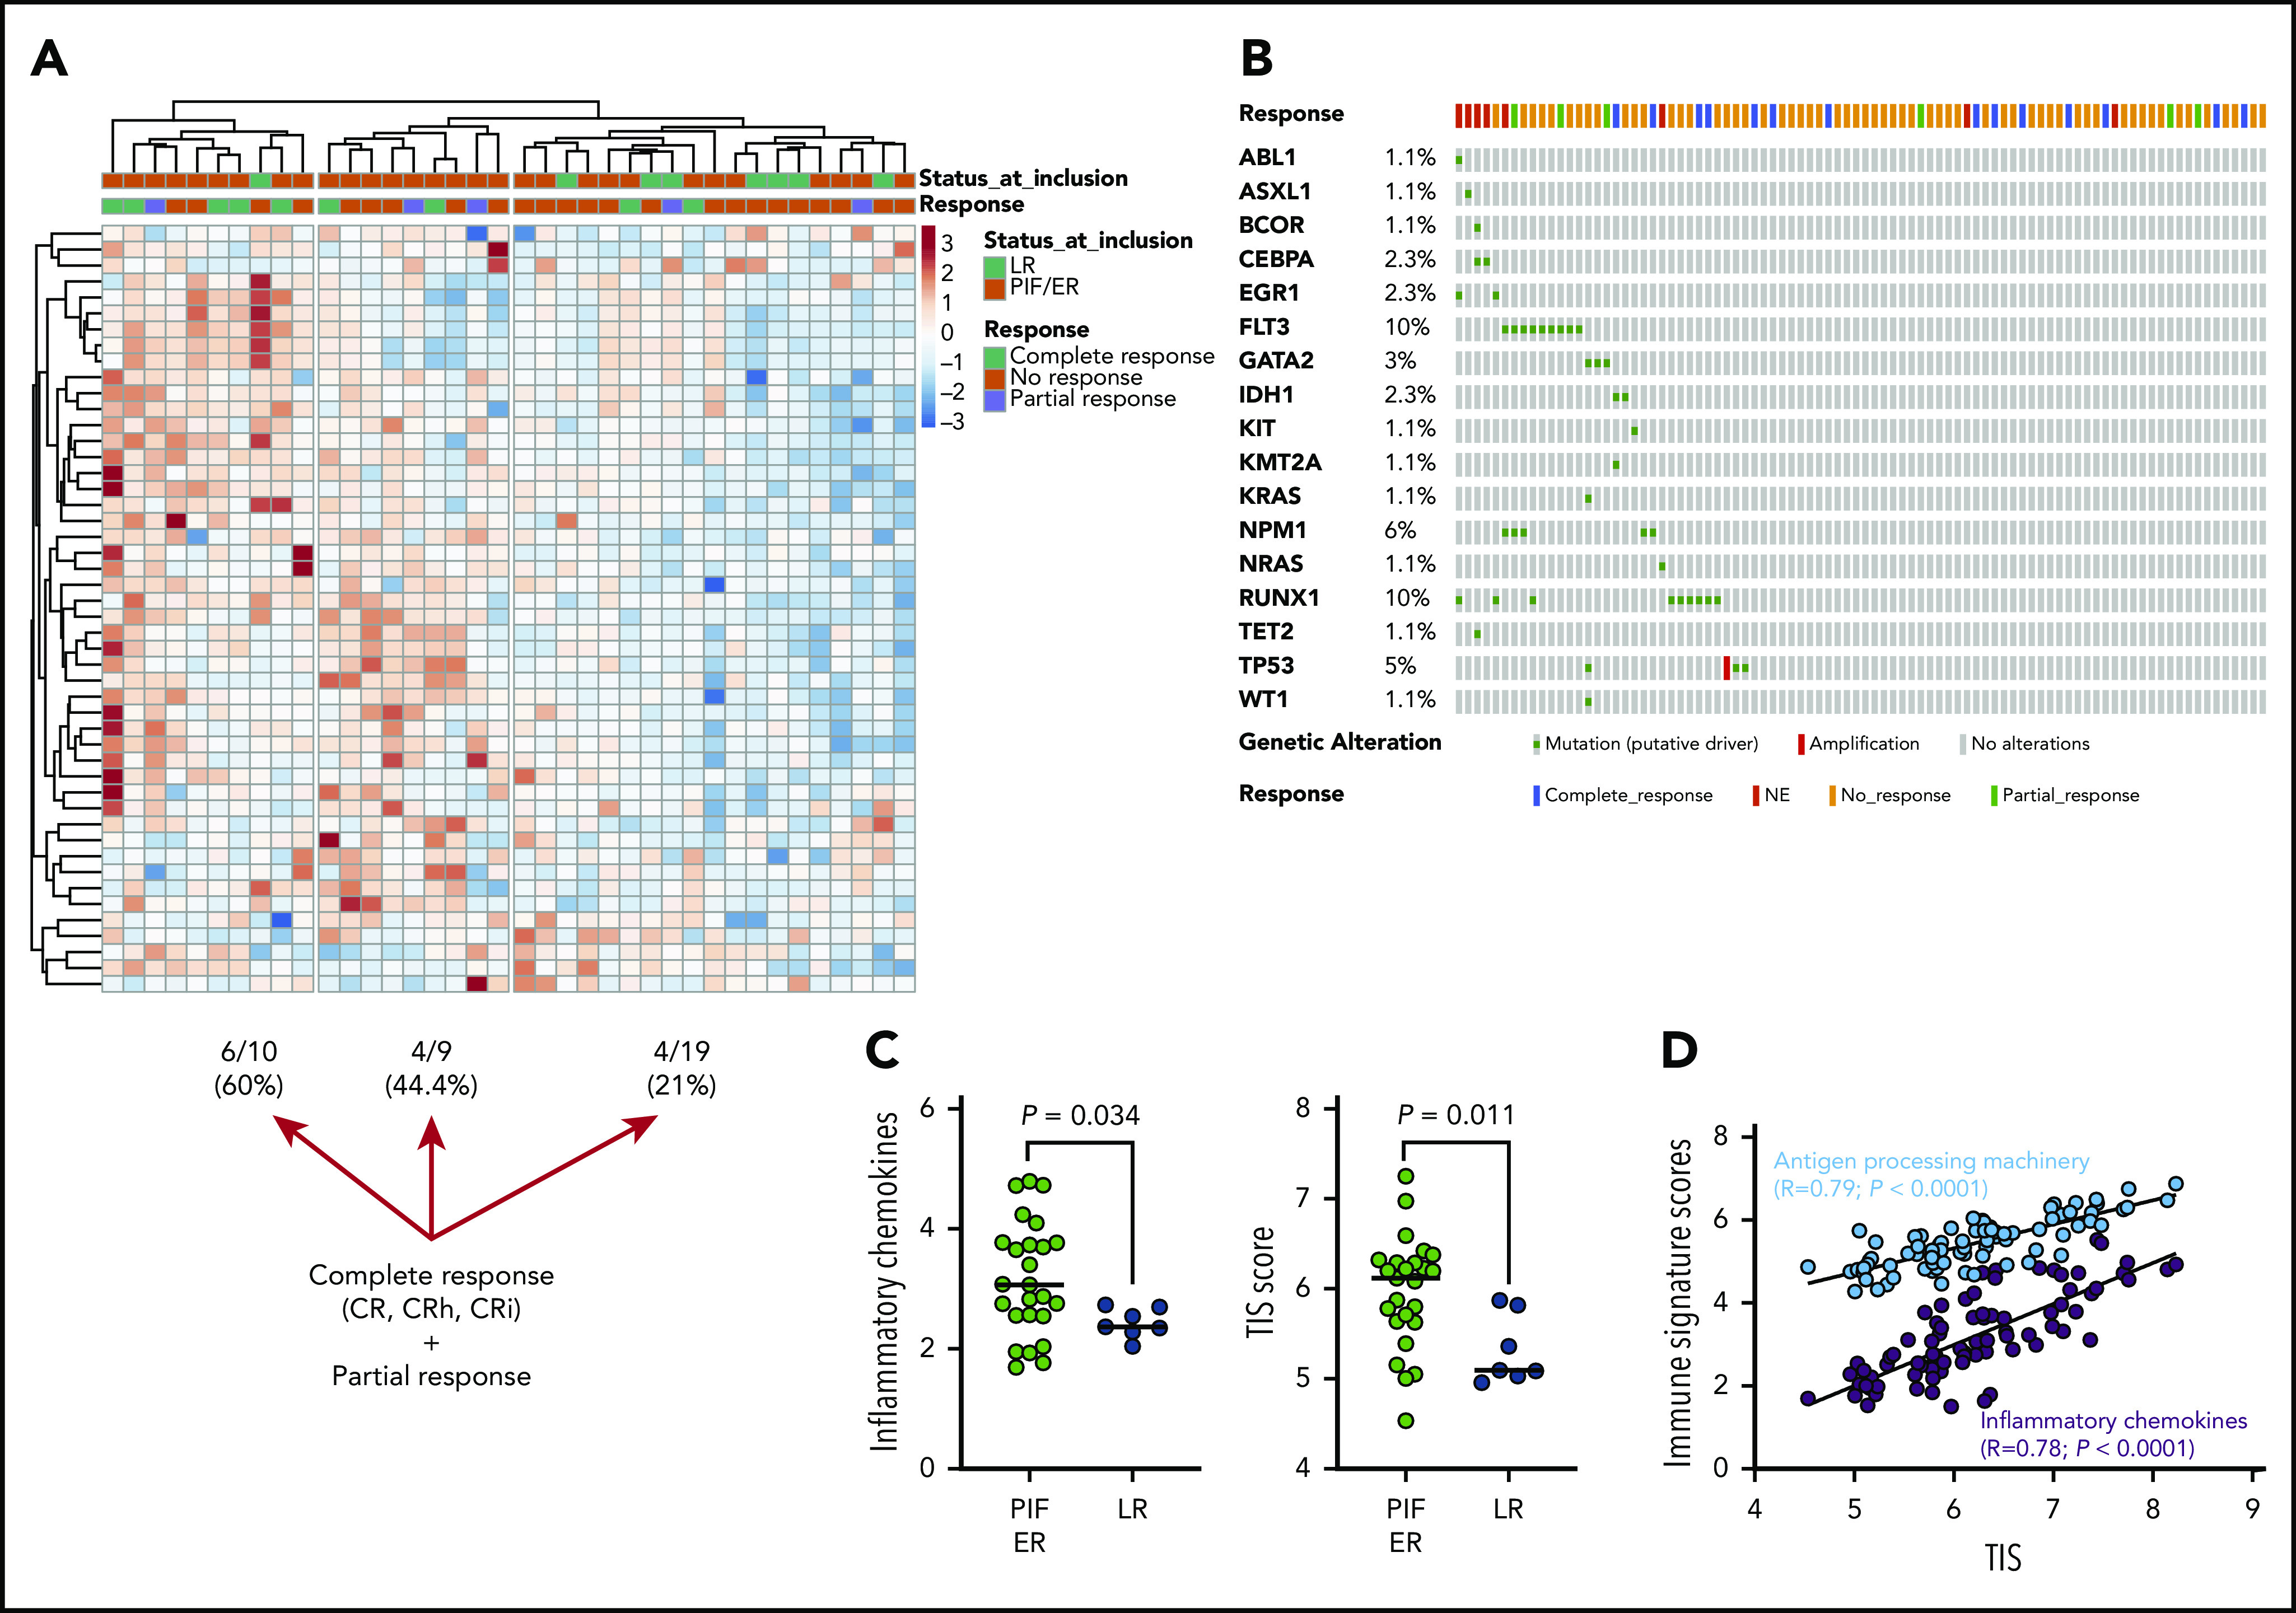
Figure 4.

The TME in patients receiving flotetuzumab immunotherapy. (A) Unsupervised hierarchical clustering (Euclidean distance, complete linkage) of immune cell type–specific scores and biological activity scores in baseline BM samples from 38 patients with R/R AML treated with flotetuzumab immunotherapy (color-coded per the legend). ClustVis, an online tool for clustering of multivariate data, was used for data analysis and visualization.40 The immune landscape from 29 of the 38 patients in this cohort has been presented in a previous publication.9 (B) OncoPrint plot summarizing the molecular profile of patients receiving flotetuzumab immunotherapy. The plot was generated using cBioPortal for Cancer Genomics (https://www.cbioportal.org/). (C) Inflammatory chemokine score and tumor-inflammation signature (TIS) score in baseline BM samples from patients with R/R AML. PIF, n = 25; LR AML, n = 7; HMAs, n = 6. Data were compared using the Kruskal-Wallis (KW) test for unpaired determinations. (D) Correlation between the TIS score and antigen processing machinery and inflammatory chemokine scores in baseline BM samples from patients with R/R AML. Spearman rank correlation coefficients and P values are shown. NE, not evaluable.
