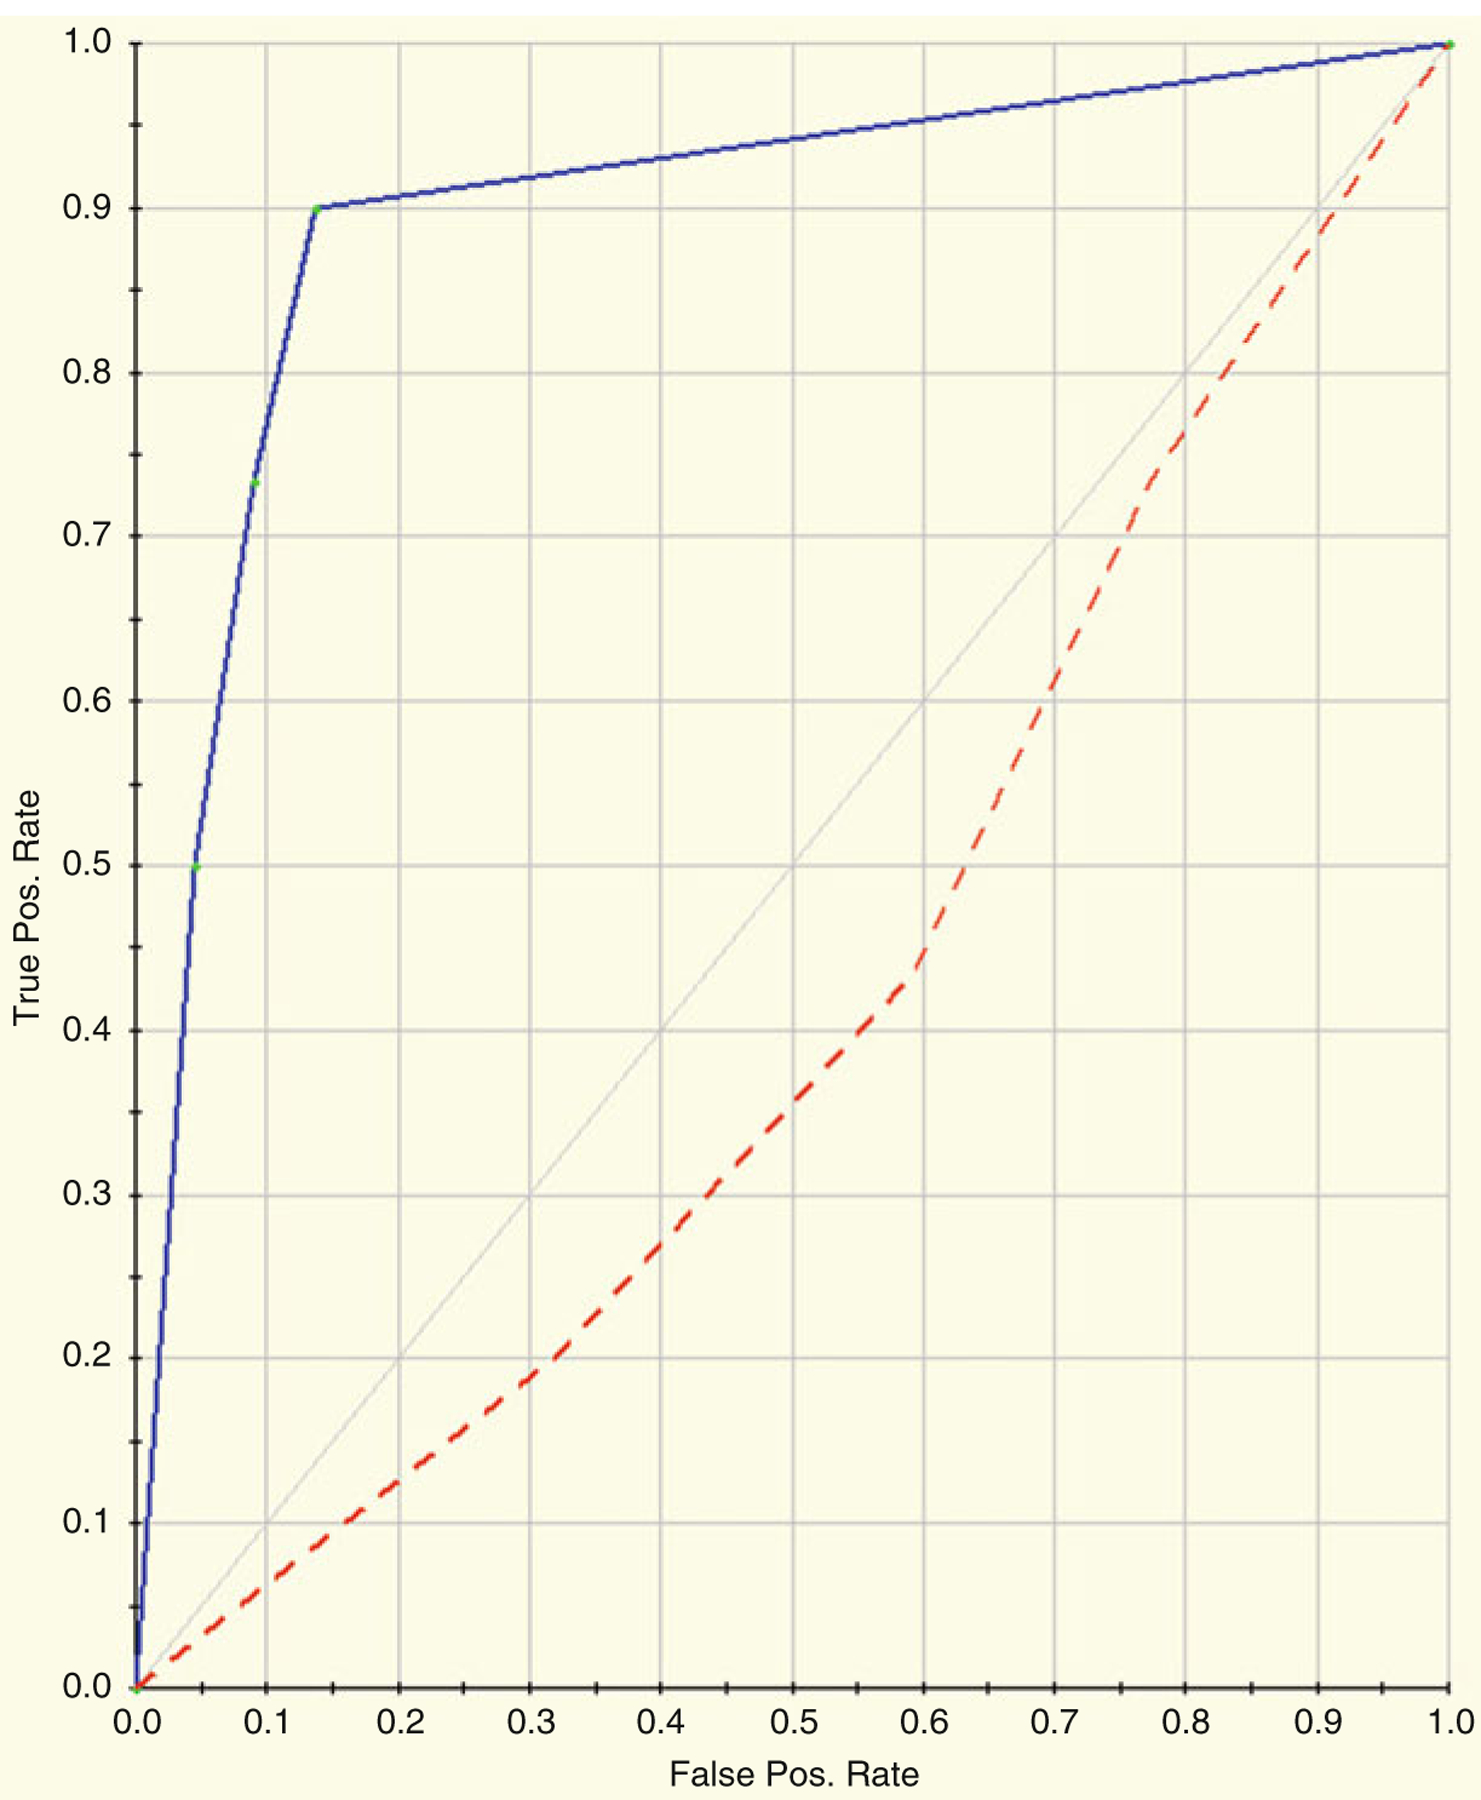
Fig. 22.7.

ROC Curves for both the training and testing datasets. The blue curve represents the training data, and the red curve represents the testing data. The AUC for the training data is 0.90 and the AUC for the testing data is 0.47

ROC Curves for both the training and testing datasets. The blue curve represents the training data, and the red curve represents the testing data. The AUC for the training data is 0.90 and the AUC for the testing data is 0.47