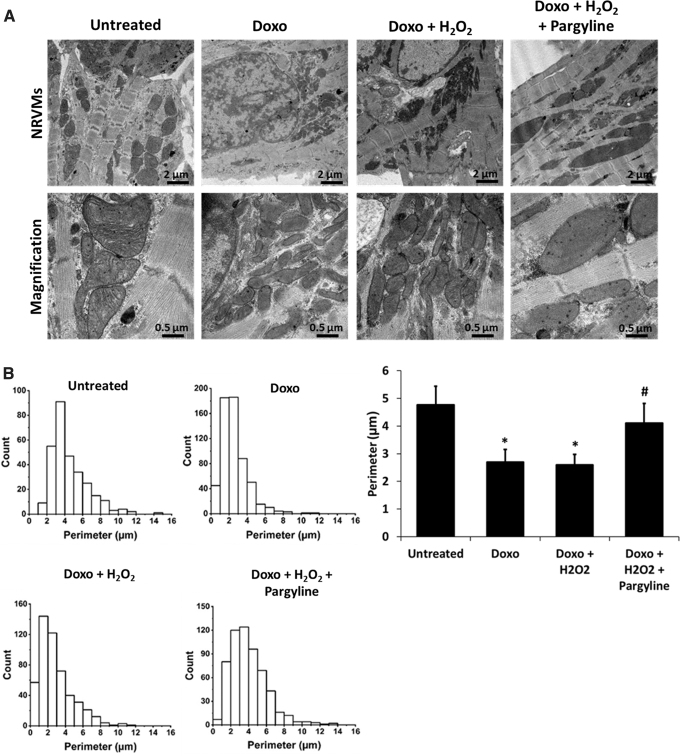
FIG. 3.
Effects of doxorubicin and MAO inhibition on mitochondrial morphology. (A) TEM of isolated NRVMs treated with 0.5 μM doxorubicin for 24 h, in the presence or absence of 100 μM pargyline. Cells have been further stimulated with 10 μM H2O2 for 1 h. (B) Probability histograms of mitochondrial perimeter, representing values count on the y axis and mitochondrial perimeter values on the x axis. The bar graph displays the average of the mitochondrial perimeter. *p < 0.001 versus Untreated, #p < 0.01 versus Doxo+H2O2 by one-way ANOVA with post hoc Tukey's multiple comparison test. Where data were not normally distributed, the Kruskal–Wallis test has been applied. All the experiments were performed three times using three different animal preparations. Untreated: N = 15 cells, 297 mitochondria. Doxo: N = 14 cells, 588 mitochondria. Doxo+H2O2: N = 11 cells, 463 mitochondria. Doxo+H2O2+pargyline: N = 15 cells, 536 mitochondria. Data are expressed as mean ± SEM. TEM, transmission electron microscopy.

