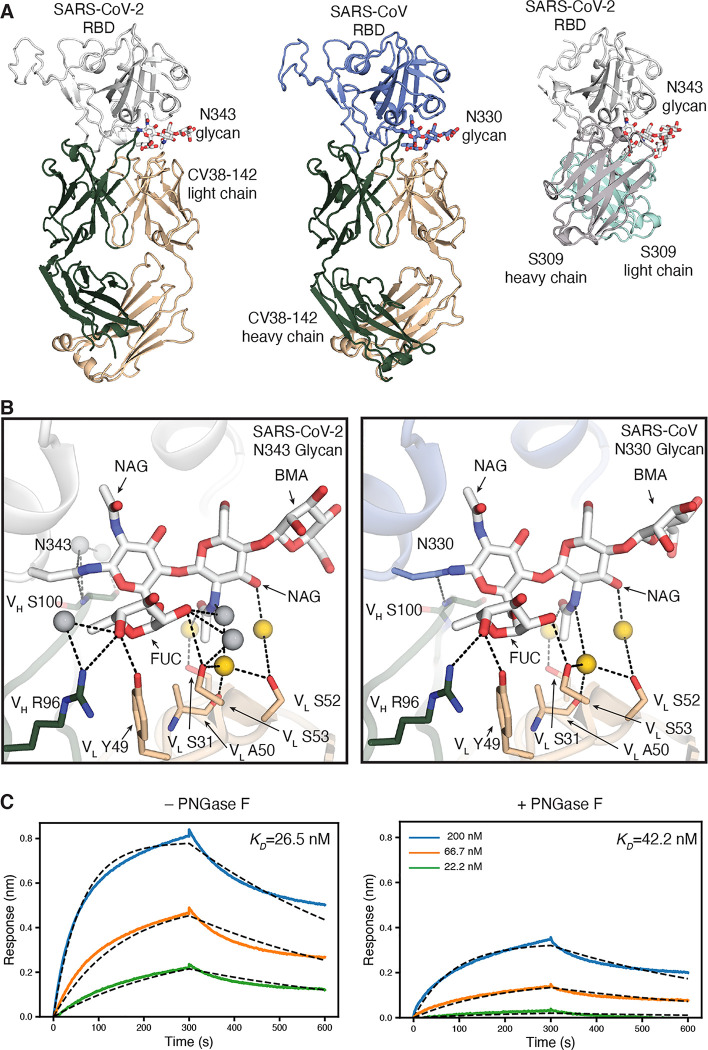
Figure 3. The CV38–142 epitope on the RBD involves an N-glycosylation site on SARS-CoV-2 and SARS-CoV.
A. Ribbon representation of the crystal structures of SARS-CoV-2 (left) and SARS-CoV (middle) RBD in complex with CV38–142 Fab and comparison to cryo-EM structure of S309 Fab in complex with spike trimer (PDB: 6WPS) (right, only the comparable RBD regions are shown). CV38–142 Fab heavy chain is in forest green and light chain in wheat, S309 Fab heavy chain in grey and light chain in cyan, SARS-CoV-2 RBD in white and SARS-CoV RBD in pale blue. The N343 glycan in SARS-CoV-2 and N330 glycan in SARS-CoV are shown as sticks. The same perspective views are used for the comparison. The overall structure of SARS-CoV-2 RBD in complex with CV38–142 and COVA1–16 is shown in Figure S1A. B. Interactions between CV38–142 Fab residues and N343 (SARS-CoV-2) and N330 (SARS-CoV) glycans are shown in stick representation. Water molecules mediating the antibody-antigen interaction are shown in spheres (grey; yellow for shared water-mediated interactions between SARS-CoV-2 and SARS-CoV). Dashed lines (black) represent hydrogen bonds. Residues of the heavy and light chain are both involved in the interactions with glycans. The interactions of CV38–142 with SARS-CoV-2 RBD and SARS-CoV RBD are similar. C. Glycan removal in the RBD decreases binding between CV38–142 and SARS-CoV-2 RBD. The binding kinetics were measured by BLI with CV38–142 Fab on the biosensor and RBD in solution. SARS-CoV-2 RBD was pretreated with or without PNGase F digestion in the same concentration and condition before being used in the BLI assay. Concentrations of RBD serial dilution are shown in the right panel. The association and disassociation were recorded in real time (s) in the x axis and response (nm) on the y axis as colored lines. Disassociation constant (KD) values were obtained by fitting a 1:1 binding model with fitted curves represented by the dash lines.

