
FIGURE 3.
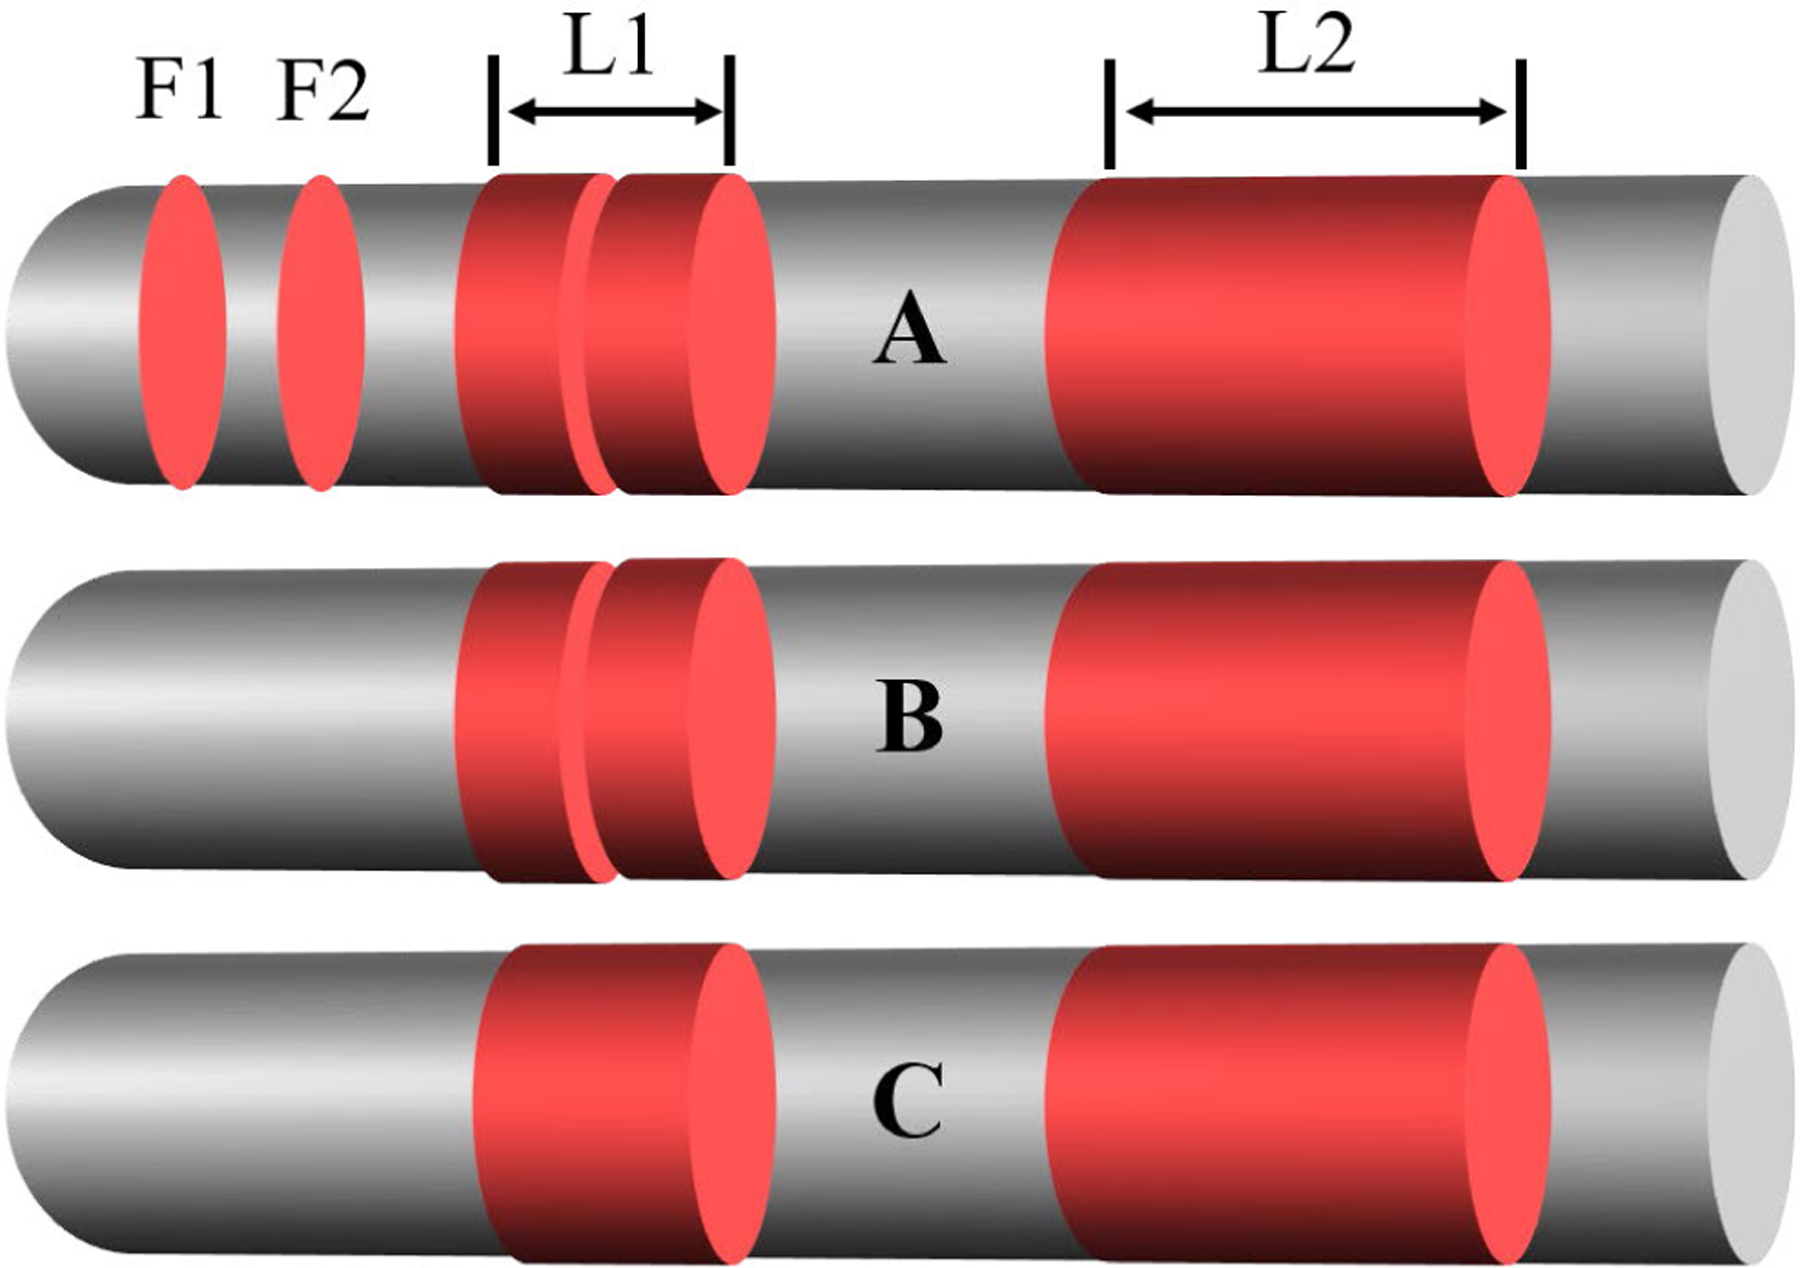
Detection of major calcification lesions (L1 and L2) using 1D morphological operations on a graph. (A) Initial detection result obtained using the 3D CNN. (B) Result after the opening operation. (C) Final result after the closing operation. Gray indicates the entire pullback and red indicates the frames with calcification. The initial classification shown in (A) includes isolated calcification frames (F1 and F2) and missing frames between two areas of calcification (L1). The isolated frames are removed with the opening operation in (B), and the missing frame is merged with the surrounding areas using the closing operation in (C).