
FIGURE 9.
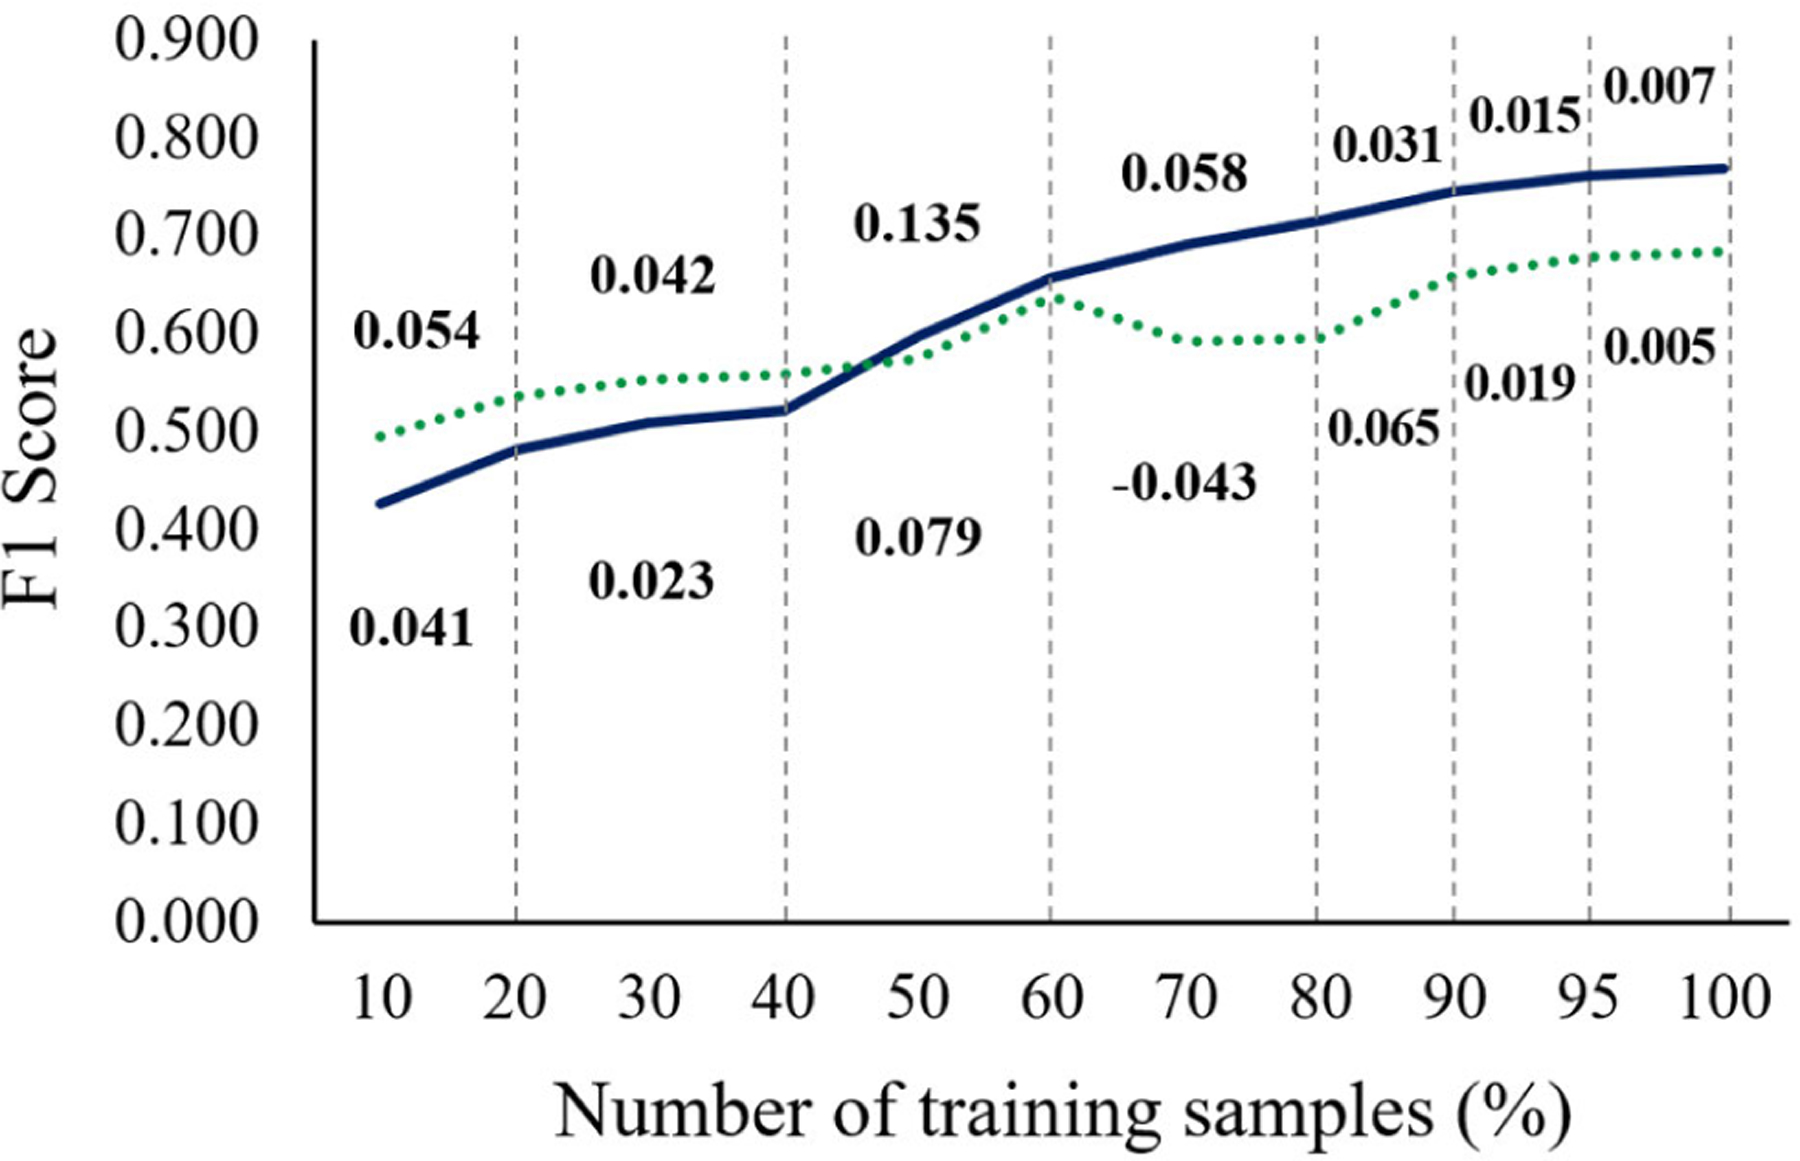
Performance curves of F1 scores for varying numbers of training samples using the one-step (dotted green) and two-step (solid blue) approaches. Ex vivo cadaveric images (4,320 frames) were utilized for the held-out test. Segmentation performance of both approaches continuously improved and reached a plateau after using 90% of the training dataset. The one-step approach required a larger dataset for training, with significantly lower F1 scores compared to the two-step approach after using 80% of the training dataset (p<0.05). The values above and below the graph are the F1 score increments for the two-step and one-step approaches.