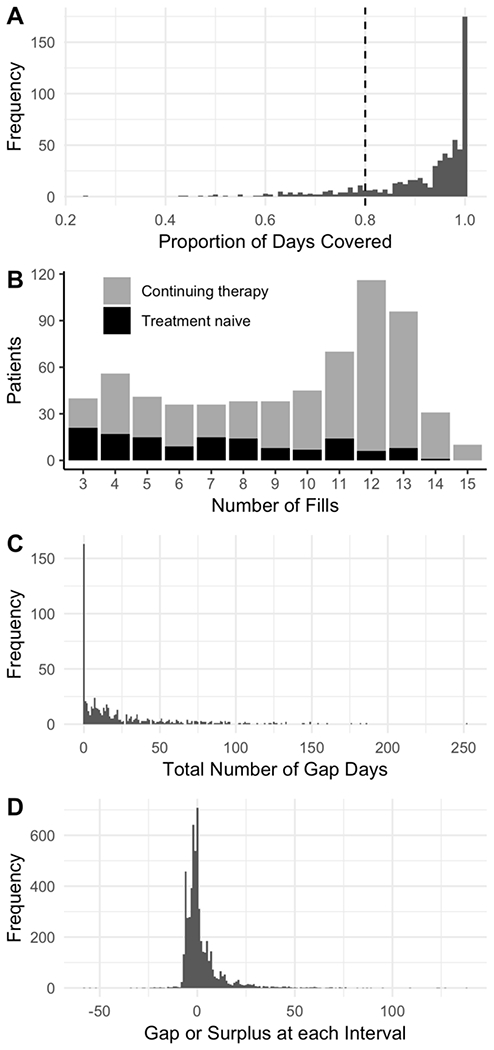
Figure 1.

Exploratory data analysis from a motivating data example, using the one-year fill history of 653 patients who were prescribed medication to treat multiple sclerosis. A minimum of three fills was required for inclusion into the study. (A) Histogram of PDC, which shows a highly skewed distribution with a large portion of the study population with 100% PDC. The dashed line indicates a threshold of 80% PDC, which is often used as an arbitrary cut point to classify non-adherent vs. adherent patients. The last fill plus method was used to determine the end date for this plot. (B) Histogram of number of fills for each patient. The most common number of fills was 12, indicating patients who started treatment before or near the study start date and were followed through to the end. Treatment naive patients make up a larger portion of the patients with low fill numbers, as patients were enrolled continuously throughout the year. (C) Total number of cumulative gap days per patient. Similar to the distribution of PDC, gap days have a high density of patients with zero gap days (which is equivalent to having a PDC of 100%), and has a long tail reaching out beyond 250 gap days. (D) Timing of fills at each interval. Positive values represent length of time between the exhaustion of supply and refilling of the medication (gap days). Negative values represent the number of days the prescription was filled early (medication surplus).(Note: this figure omits a 252-day gap in order to provide more detail where the majority of the data lie.)
