
Figure 3.
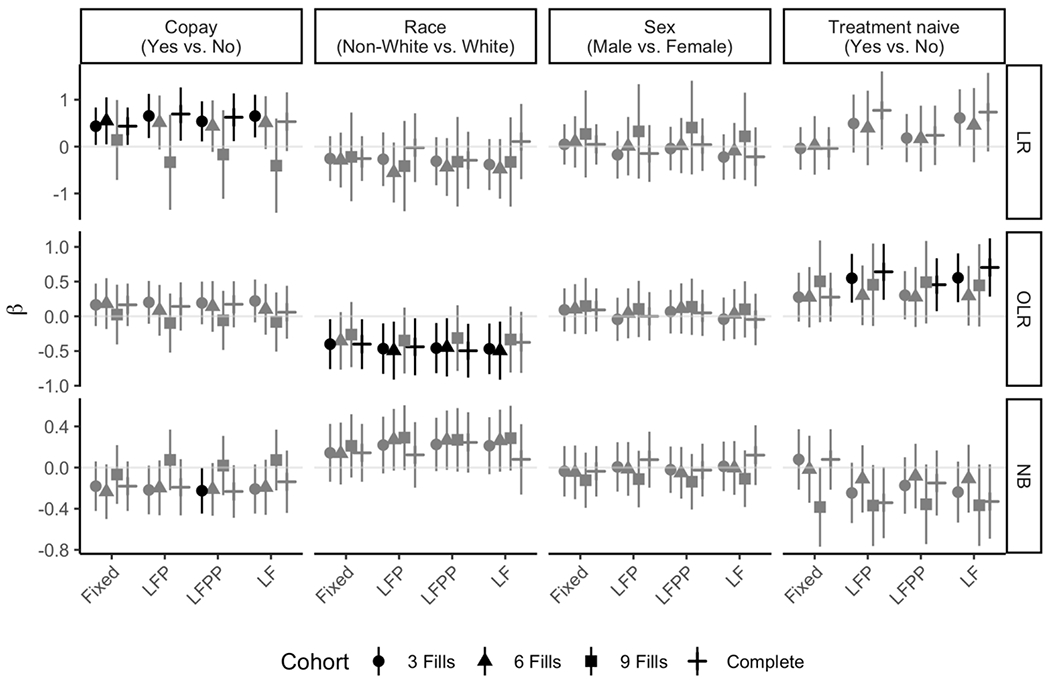
Sensitivity analyses for each of the three statistical models applied each of the four end date rules and four cohort restrictions. Significant results are denoted with black points (the estimates) and lines (the 95% confidence intervals), while non-significant estimates are shown in grey. (Note: for the LR case of ≥ 9 fills, the estimates and the 95% confidence intervals are not shown because of quasi-separation within the treatment naive variable, i.e., too few patients are below 80% PDC to obtain reliable estimates.)