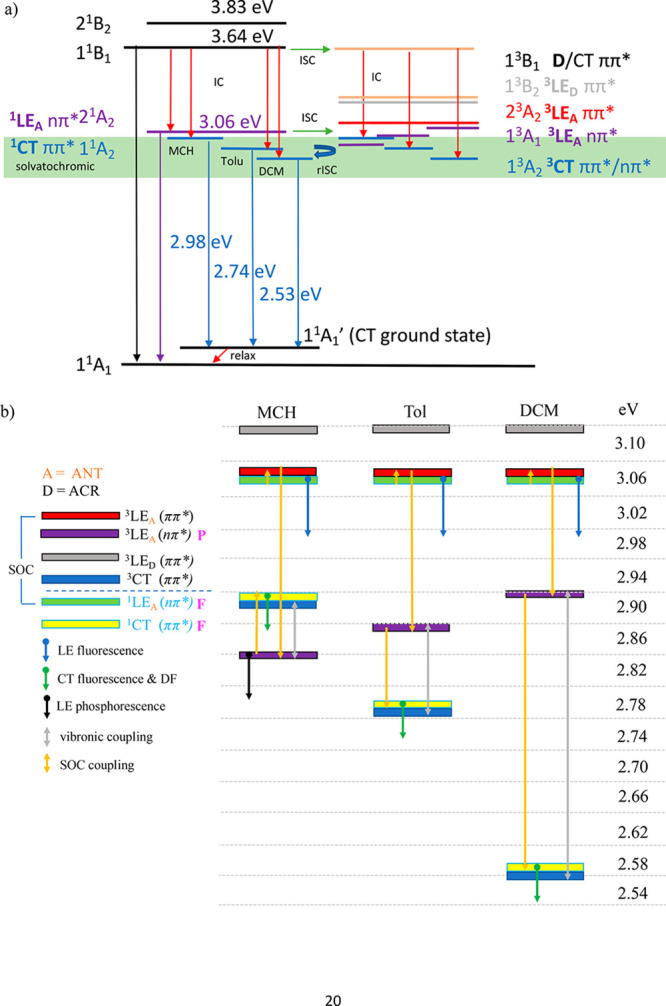
Figure 8.

Energy level scheme for ACRSA. (a) Measured energy levels from spectral onsets of ACRSA in different polarity solvents, following the nomenclature of Lyskov and Marian.24 The green band represents the energy range over which we observe solvatochromic states. Red arrows represent nonradiative transitions. (b) The effect of solvent polarity on the states and the SOC (yellow arrows) and vibronic coupling (gray arrows) between states giving rise to ISC and rISC.
