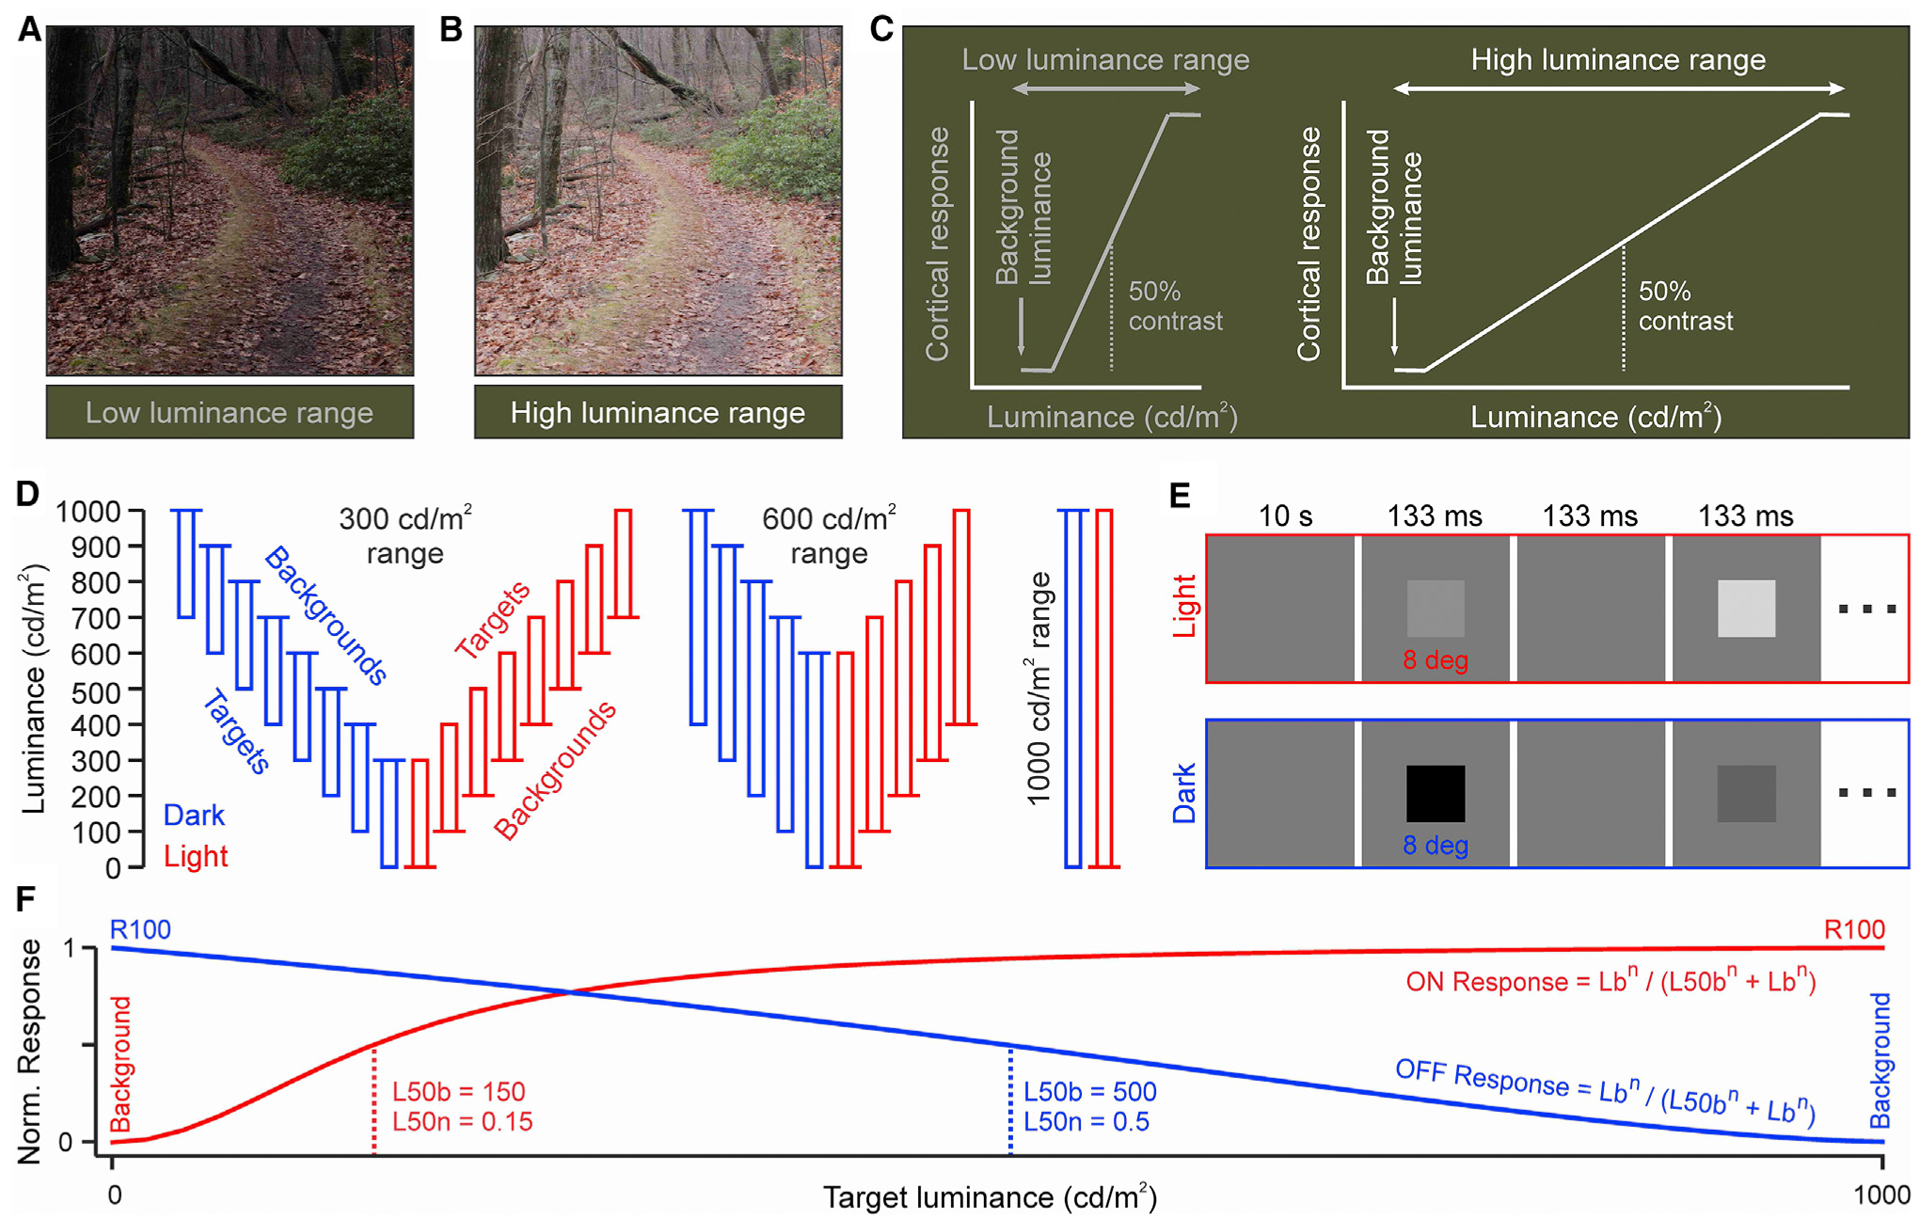
Figure 1. Measuring the effect of luminance range on contrast sensitivity.

(A) Natural image with low luminance range.
(B) The same image with higher luminance range.
(C) Cartoon illustrating how an expansion of luminance range affects the neural signaling of contrast range.
(D) Stimulus combinations of contrast polarity, background luminance, and luminance range. Each rectangle represents a sequence of stimuli with different luminance contrast but the same polarity (red: light, blue: dark in all figures). The longer horizontal line on the top or the bottom of the rectangle illustrates the background luminance. The longer side of the rectangle illustrates the luminance range.
(E) Stimulus temporal sequence.
(F) Naka-Rushton function fit to the cortical responses and its main parameters: the luminance that generates half-maximum response (L50), the exponent (n), and the response generated by the maximum contrast (R100). L50b is L50 minus the background luminance. L50n is L50b divided by the luminance range. Lb is the stimulus luminance minus the background luminance.
