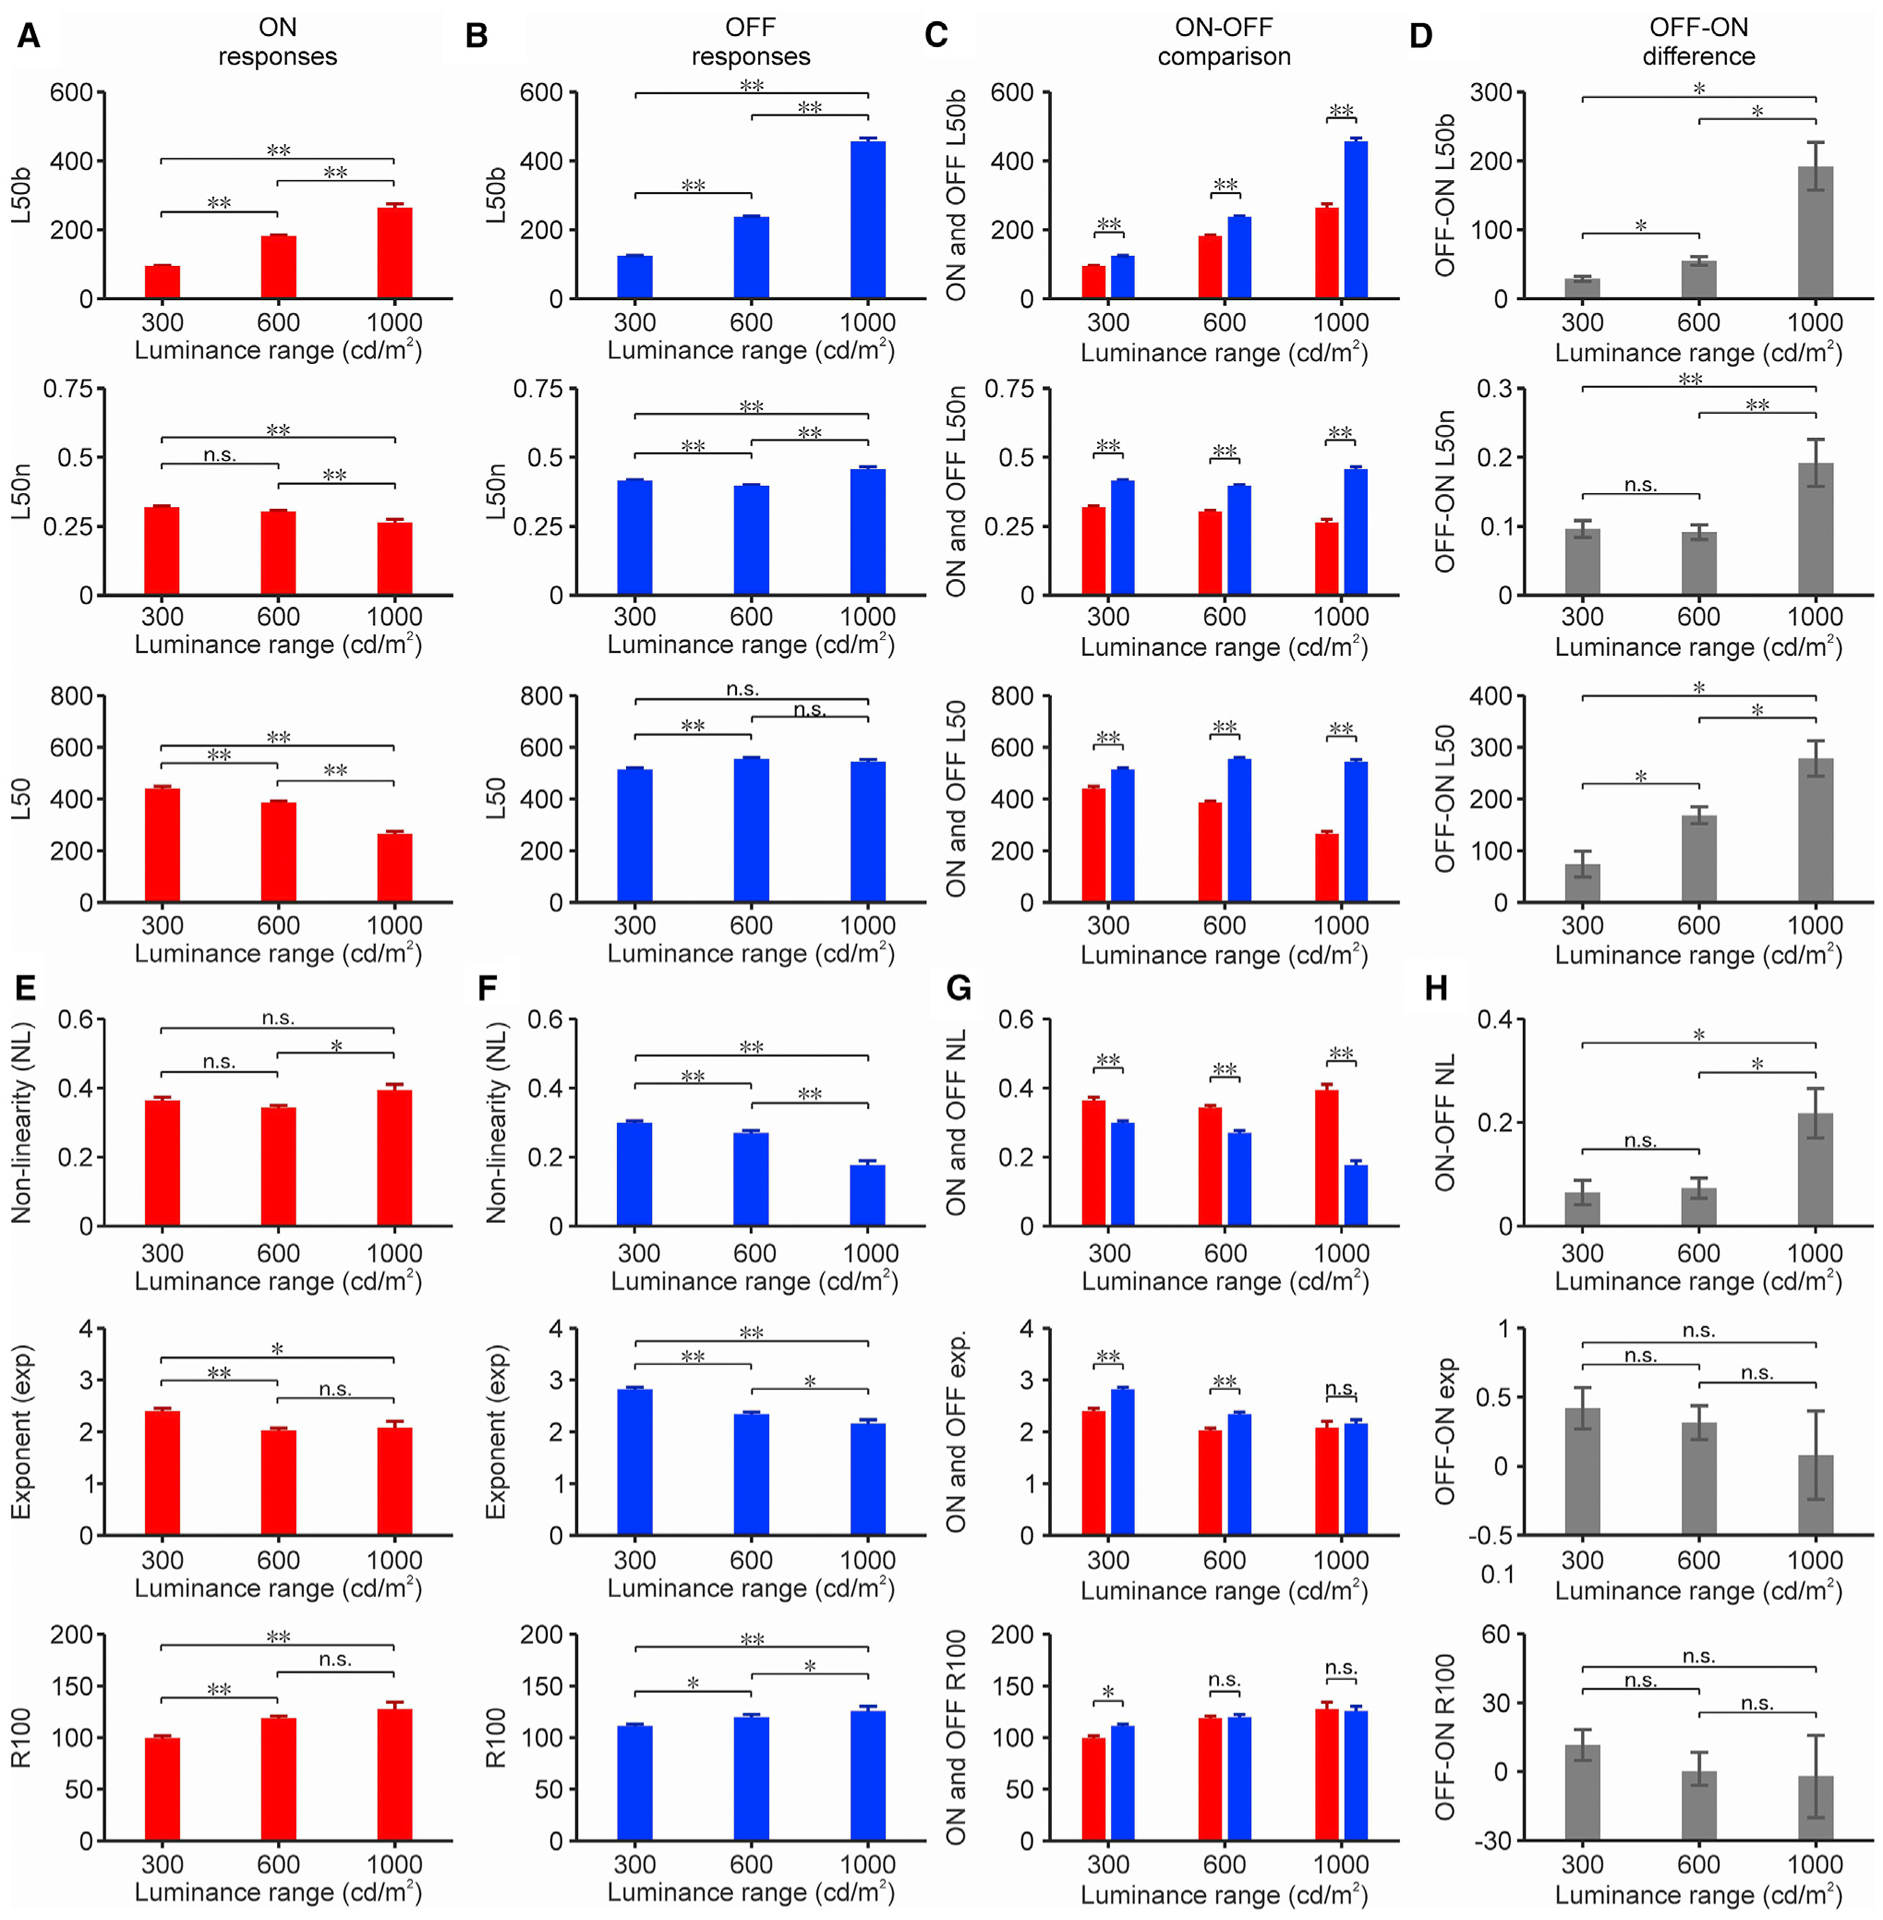
Figure 3. Effects of luminance range on cortical response functions.

(A) Average L50b (top), L50n (center), and L50 (bottom) measured at 3 different luminance ranges from ON onset responses (n: 670, 685, and 110 cortical recording sites listed from lowest to highest luminance range).
(B) Same for OFF onset responses (n: 1,113, 818, and 217 cortical recording sites listed from lowest to highest luminance range).
(C) ON and OFF values superimposed for comparison.
(D) Difference between OFF and ON values. *p < 0.05, p < 0.001; ns, not significant (bootstrap resampling, 50,000 repetitions).
(E–H) Same for NL (top), exponent (center), and response at maximum contrast (R100, bottom).
For (A)–(C), *p < 0.05, **p < 0.001; ns, not significant (2-sided Wilcoxon rank sum test).
See also Figures S1 and S2.
