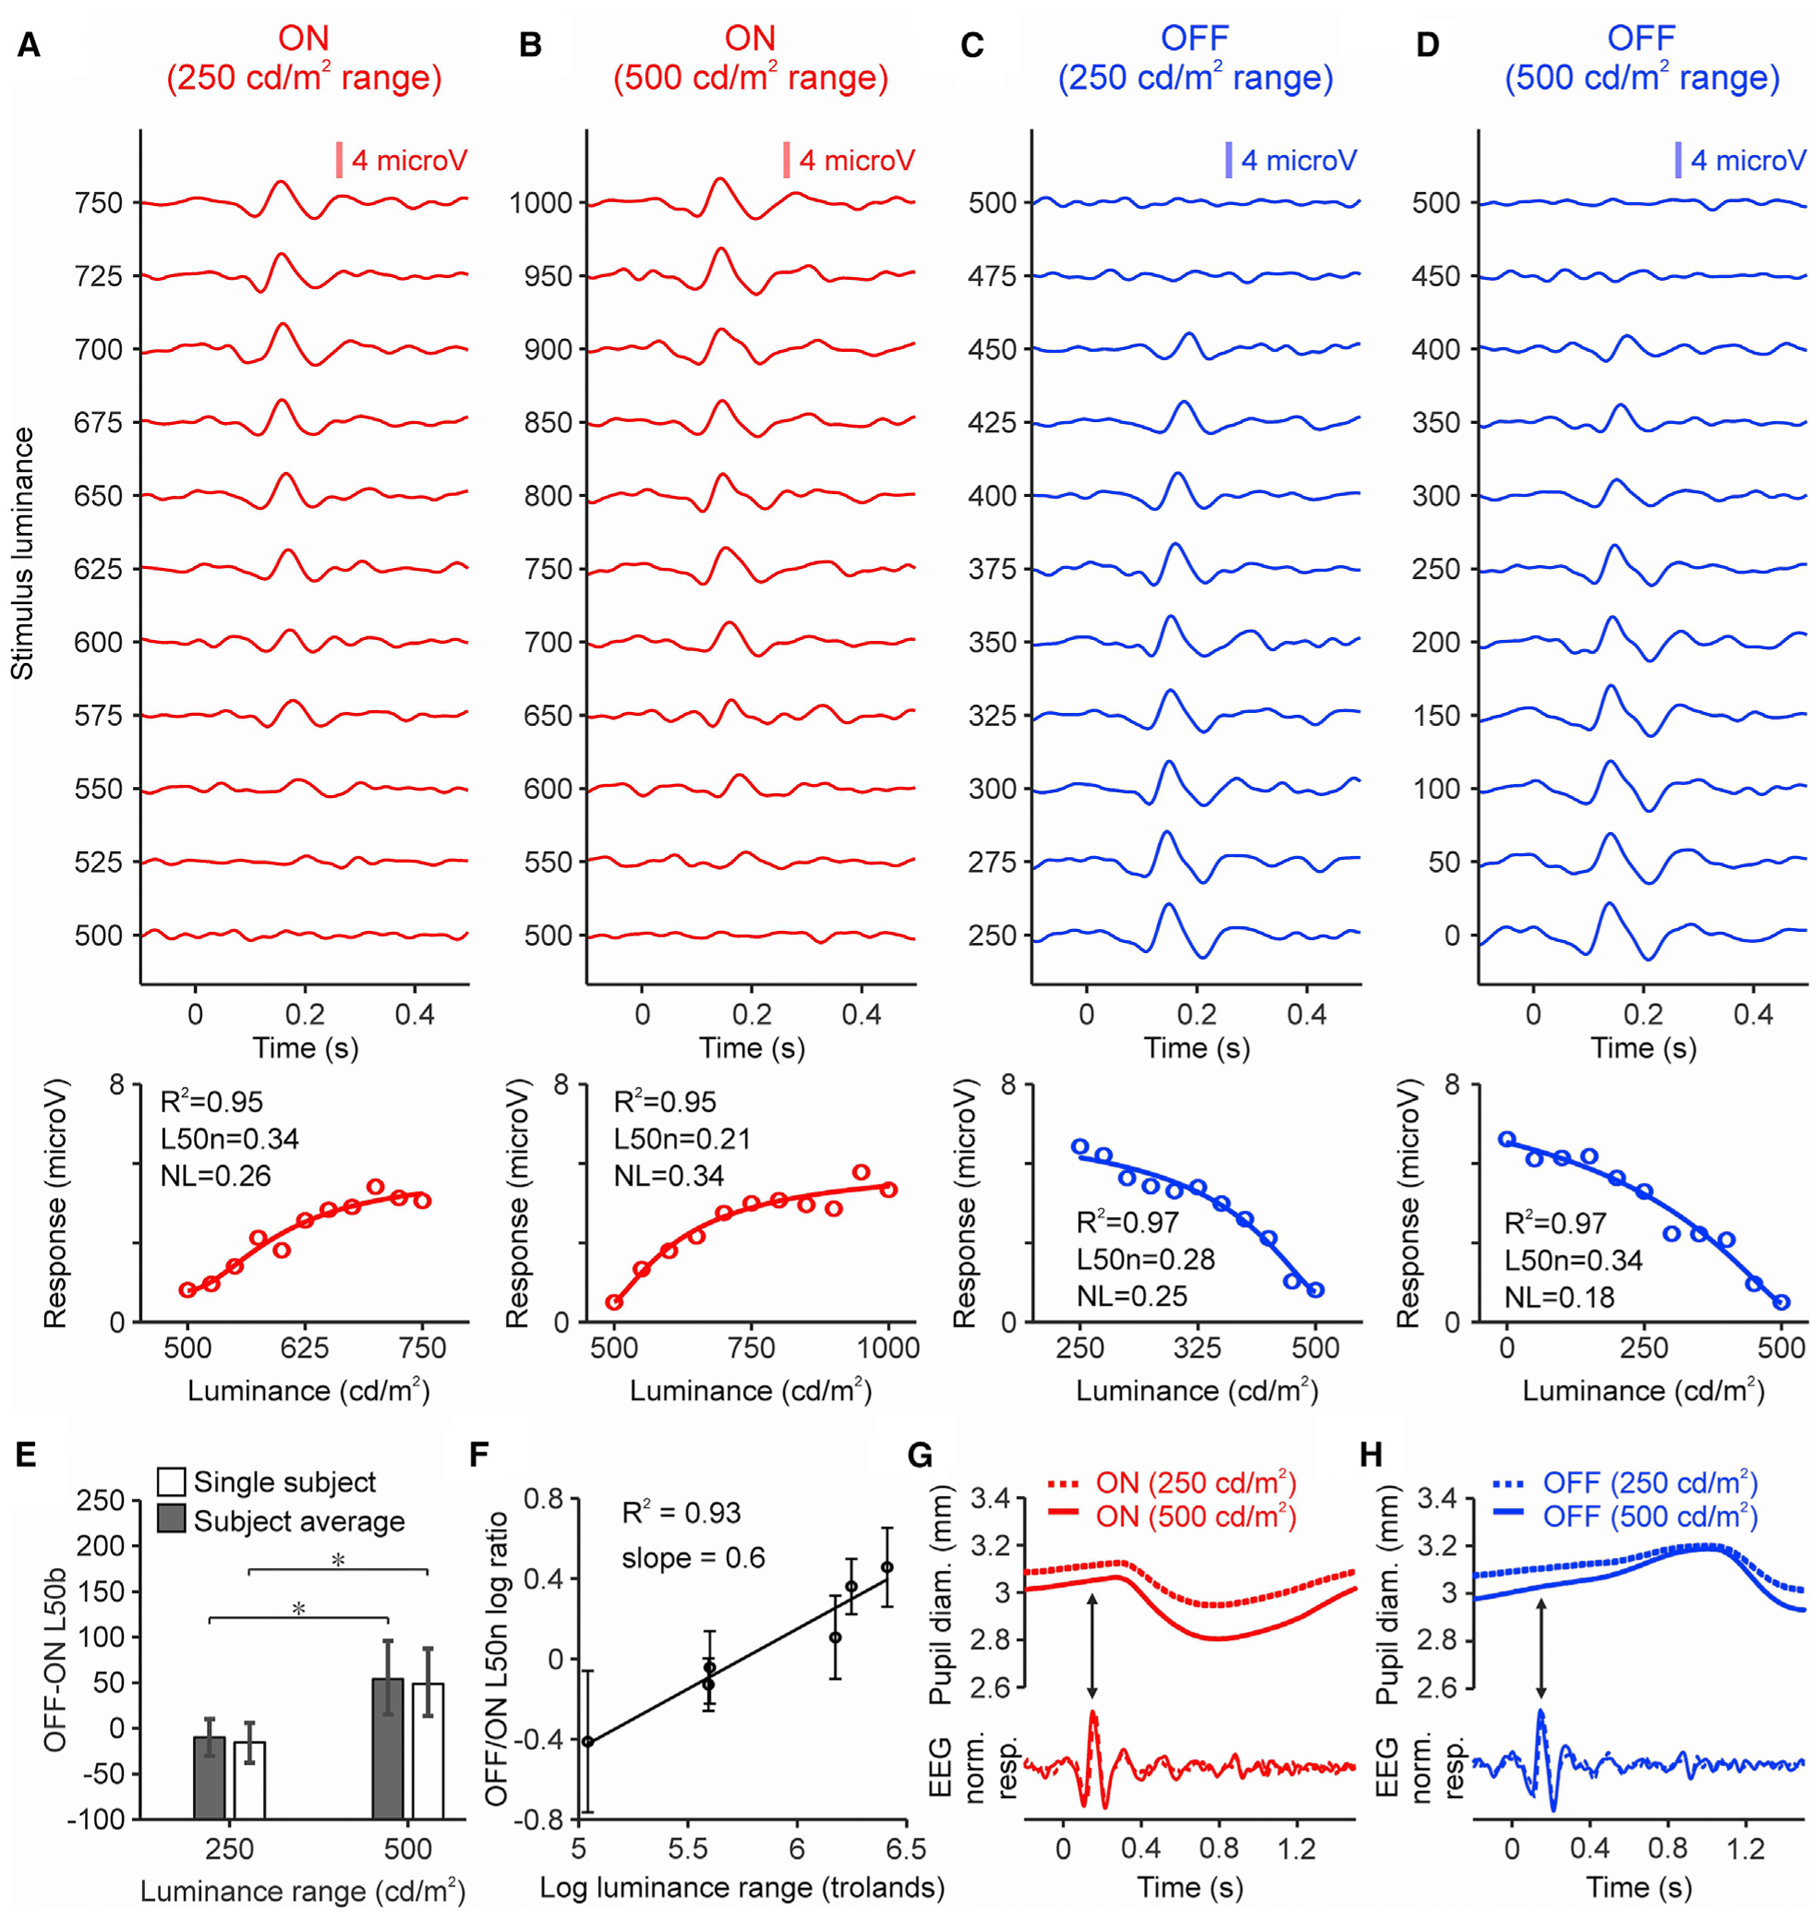
Figure 5. Luminance response functions in human visual cortex.

(A) Top: ON cortical responses to different stimulus contrasts measured in a human subject (luminance range: 250 cd/m2, 30 trials per contrast for each background luminance, light-dark polarity, and luminance range). Bottom: cortical responses (circles) fit with a Naka-Rushton function (line). Top left corner shows goodness of fit (R2), L50n, and NL.
(B) Same for luminance range of 500 cd/m2.
(C and D) Same for OFF responses.
(E) OFF-ON differences in L50b measured in the same subject (white) and subject average (gray). *p < 0.05 (bootstrap resampling, 50,000 repetitions).
(F) Logarithmic relation between luminance range and OFF/ON L50n ratio (bootstrap resampling, 50,000 repetitions).
(G) Pupil response of same subject (top) measured at 250 (dotted line) and 500 cd/m2 luminance ranges (continuous line) at the peak (arrow) of the ON cortical response (bottom).
(H) Same for OFF responses.
See also Figure S3.
