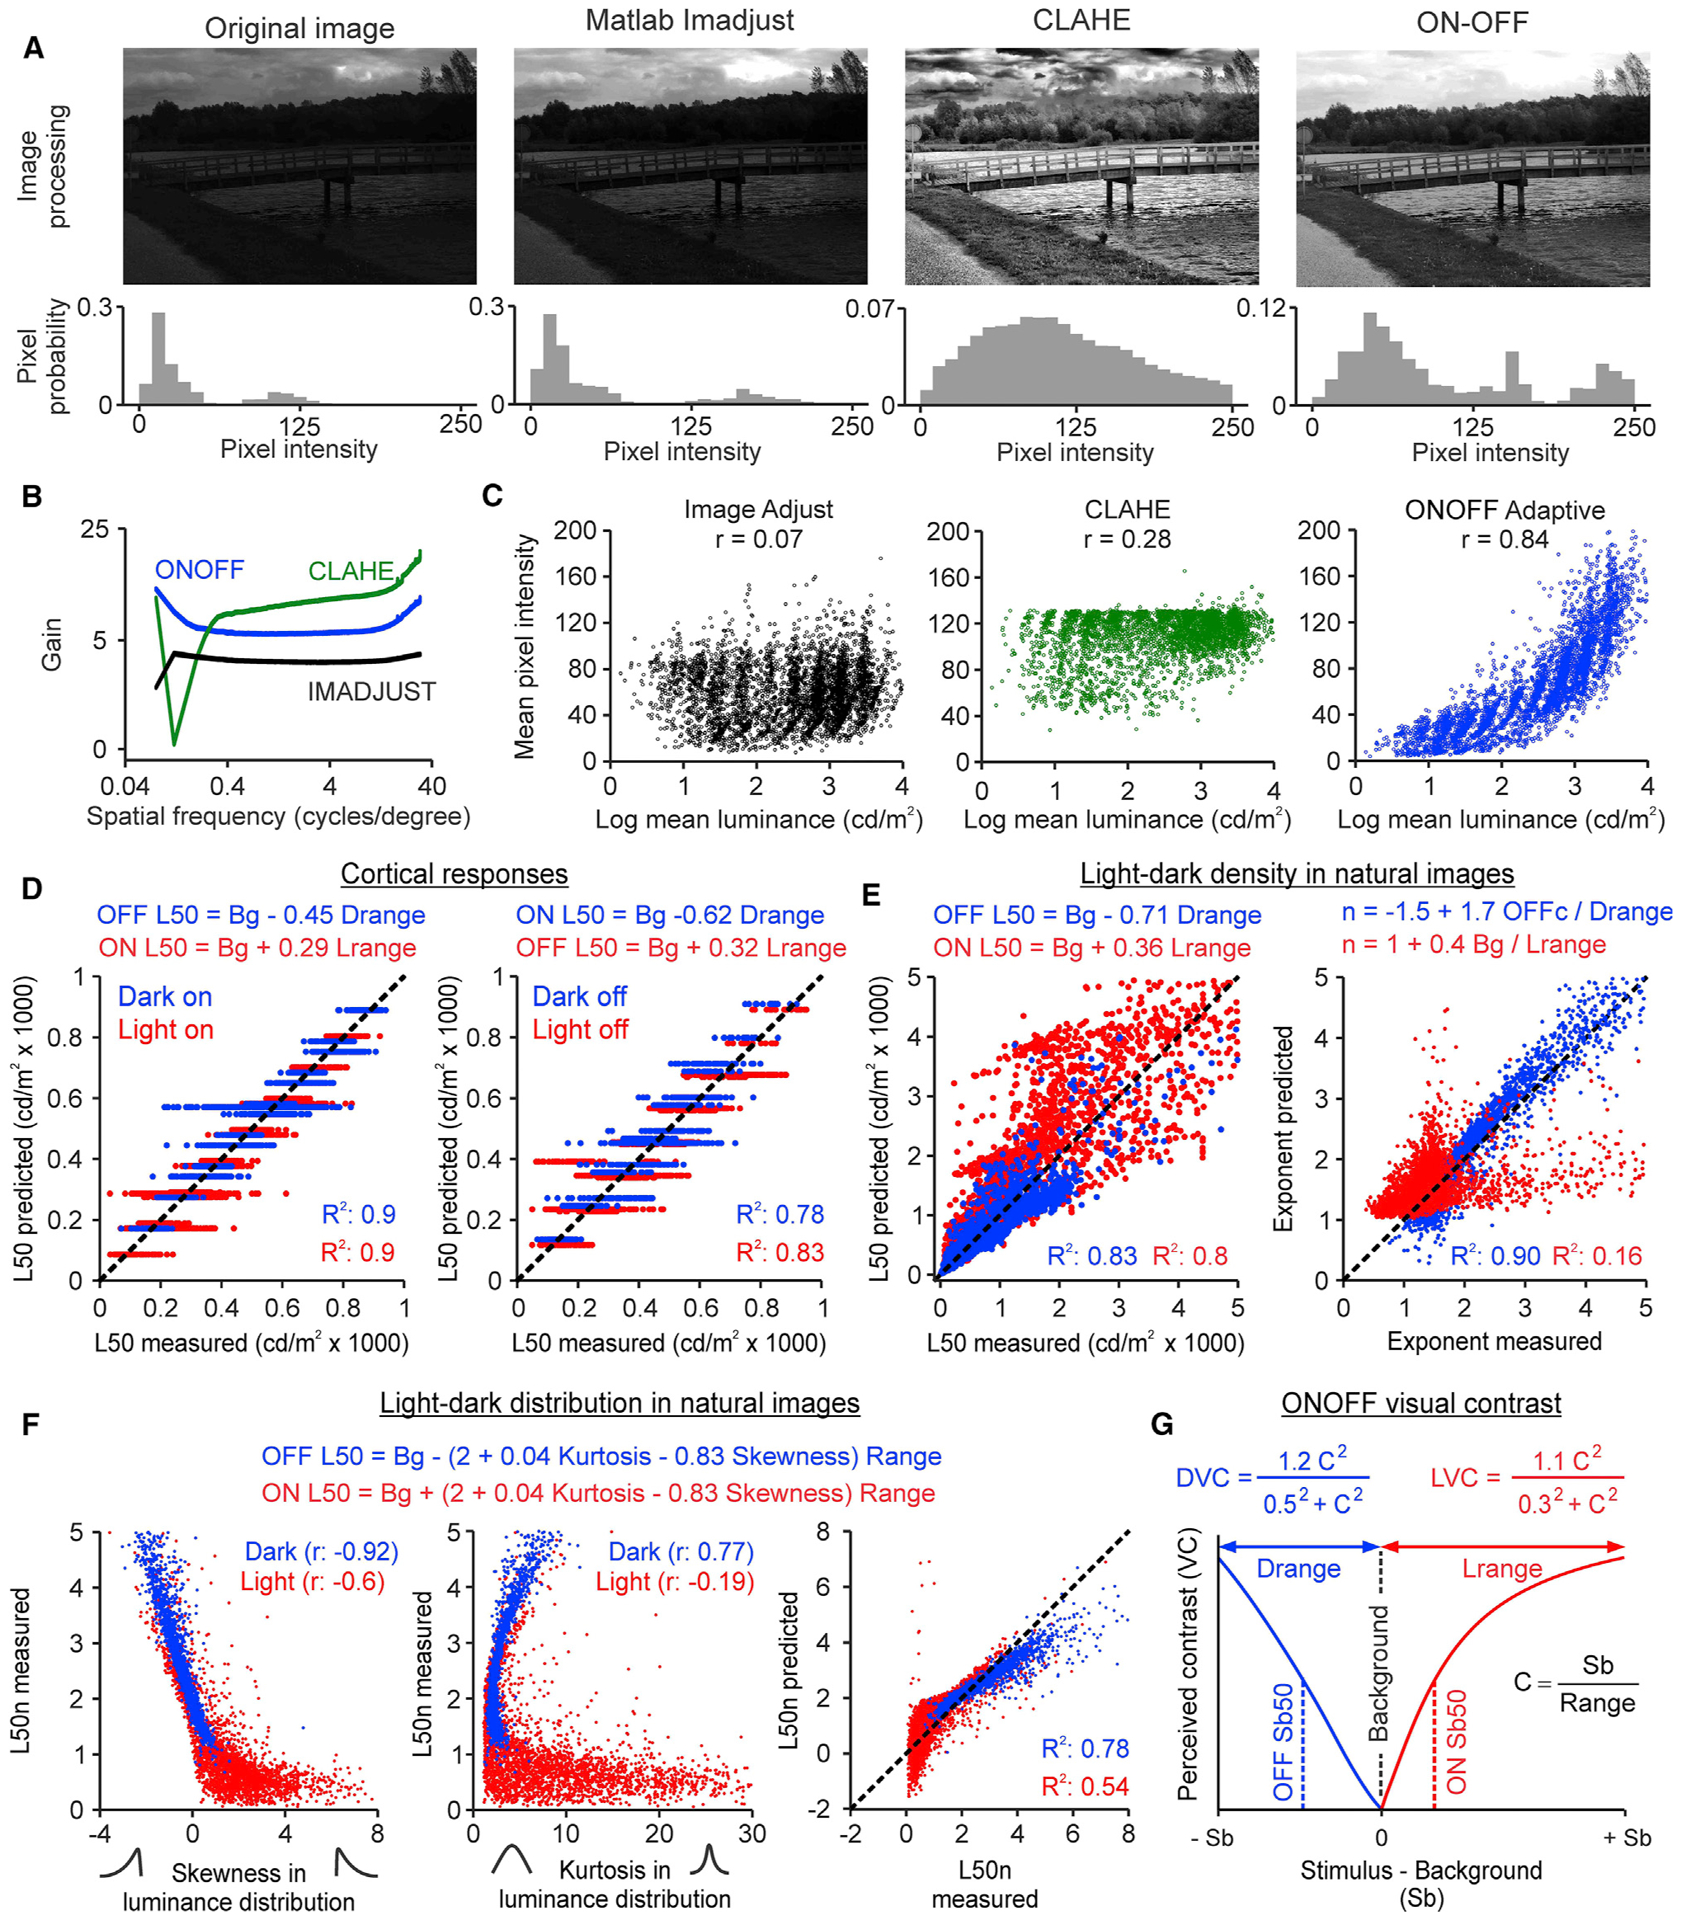
Figure 7. ONOFF image processing and visual contrast.

(A) The left panels show a natural image (van Hateren and van der Schaaf, 1998) normalized by its maximum (top) and a histogram of image pixel intensity (bottom, 1,024 × 1,531 pixels). The other panels show the same for images processed with IMADJUST, CLAHE, and ON-OFF algorithms.
(B) Contrast gain from IMADJUST (black), CLAHE (green), and ON-OFF (blue, n: 4,167 images).
(C) Correlations between the mean luminance of the original image and the pixel intensity of the processed image (n: 4,167 images).
(D) ON and OFF L50 (x axis) can be accurately predicted (y axis) with linear regression models (equations at the top) for both onset responses (left) and rebound responses (right). Notice that for each combination of background and range, the model returns a single value, but the measured L50 is more variable (n: 331 recording sites for ON onset responses, 520 recording sites for OFF onset responses, 275 recording sites for ON rebound responses, and 321 for OFF rebound responses).
(E) Left: ON and OFF L50 of the image density functions (x axis) and prediction (y axis) with a linear model (equations at the top, n: 3,247 ON images and 3,247 OFF images with mean luminance >50 cd/m2). Right: same as left but for the exponent of the ON and OFF functions (n: 3,112 ON images and 3,175 OFF images with accurately fitted luminance response functions, R2 > 0.9).
(F) Correlations of the image L50n with the skewness (left) and kurtosis (center) of the luminance distributions, and model predictions (right, equations at the top, n: 3,247 ON images and 3,247 OFF images with mean luminance >50 cd/m2).
(G) Definition of ONOFF contrast. DVC, dark visual contrast; LVC, light visual contrast; Range, luminance range; Sb, stimulus luminance minus background luminance.
See also Figure S4.
