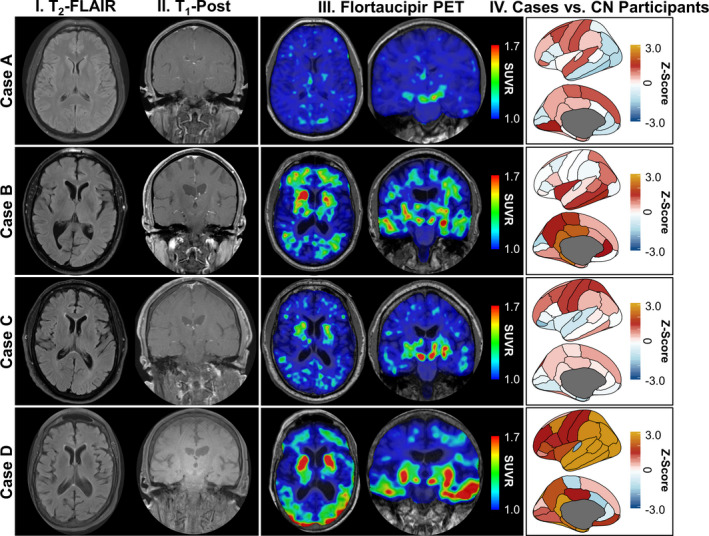
Figure 1.

Selected neuroimaging in LGI1 antibody encephalitis patients. Structural magnetic resonance brain images (T2‐FLAIR [column I] and T1‐post contrast [column II]) and flortaucipir PET images (axial and coronal orientation, column III) are shown for each patient with LGI1 antibody encephalitis (cases A–D; presented in radiologic convention). Column IV shows [18F]flortaucipir uptake in LGI1 antibody encephalitis patients referenced to uptake in cognitively normal individuals (n = 124) across 46 regions of interest. FLAIR = fluid attenuated inversion recovery; PET = positron emission tomography; CN = cognitively normal; LGI1 = leucine‐rich glioma‐inactivated 1; SUVR = standardized uptake ratio value.
