Figure 1.

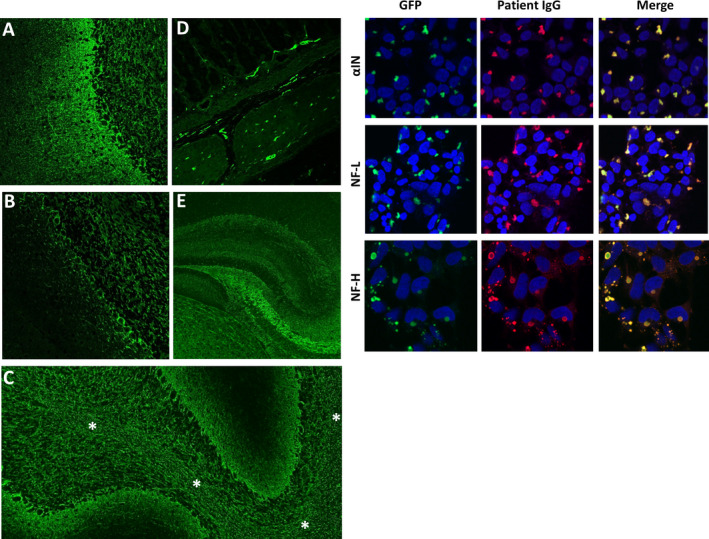
NIF‐IgG studies in CSF. Left panels, A‐E, patterns of NIF‐IgG staining of mouse tissue by indirect immunofluorescence. A, pattern 1 (αIN‐ or NF‐L‐predominant); staining throughout the cerebellum with prominent blush in the molecular layer (left). B, pattern 2 (NF‐H‐predominant); staining is mostly restricted to the granular layer (right) and Purkinje cell layer (middle), with sparse molecular layer staining (left). Staining of other elements, such as white matter (C, asterisks), myenteric plexus (D), and hippocampus (E), are identical for patterns 1 and 2. Right, HEK‐293 cell‐based assay confirming positivity for all three NIF‐IgG subtypes evaluated in a patient whose CSF produced pattern 1 NIF‐IgG staining by the tissue‐based assay.
