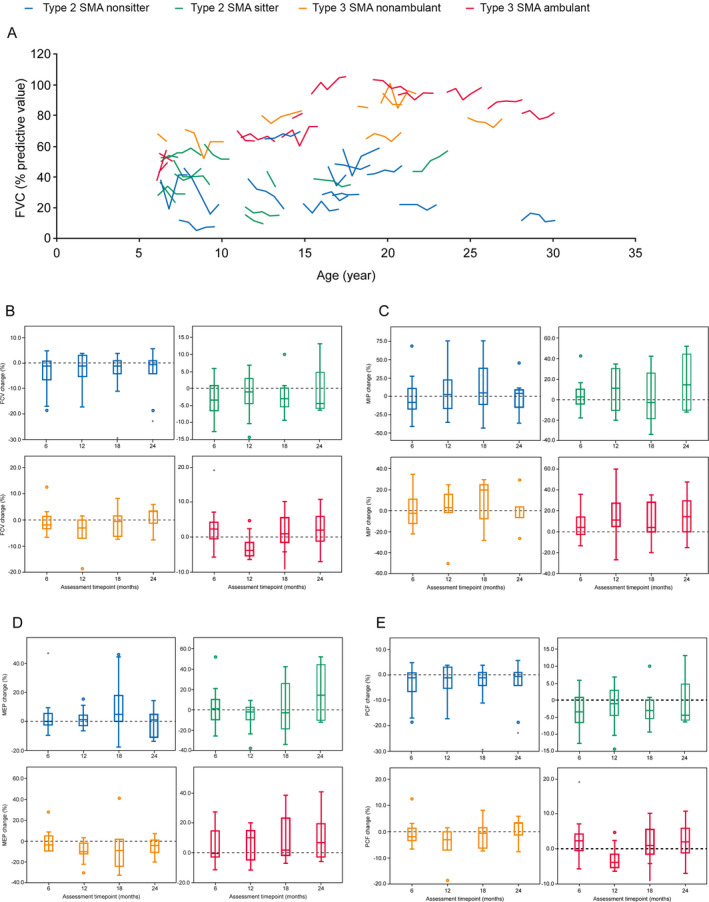
Figure 5.

(A) Change in FVC over 24 months according to age. B–E) Change in FVC, MIP, MEP, and PCF over 24 months by SMA type. (A/B) FVC change was measured using the Vitalograph spirometer at baseline, Month 6, 12, 18, and 24 (Month 12, n = 40; Month 24, n = 27). Each line represents the trajectory of one patient over 24 months. (C) MIP was evaluated using the MicroRPM device at baseline, Month 6, 12, 18, and 24 (Month 12, n = 40; Month 24, n = 27). (D) MEP was evaluated using the MicroRPM device at baseline, Month 6, 12, 18, and 24 (Month 12, n = 40; Month 24, n = 27). (E) PCF was measured using the Vitalograph spirometer at baseline, Month 6, 12, 18, and 24 (Month 12, n = 40; Month 24, n = 26). Closed circles represent outliers. FVC, forced vital capacity; MEP, minimum expiratory pressure; MIP, minimum inspiratory pressure; PCF, peak cough flow; SMA, spinal muscular atrophy.
