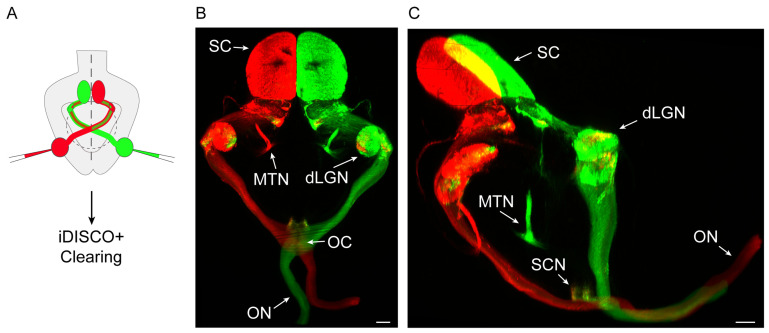
Figure 1. Three-dimensional (3D) view of retinal axons projecting to the visual nuclei within the mouse brain.
A. Scheme of the experimental approach. A postnatal mouse is injected with fluorescent tracers of different colours in each eye and then processed through the iDISCO+ clearing protocol24. B. Dorsal view of a light sheet fluorescence microscope (LSFM)-acquired 3D image stack from the whole brain of a mouse injected with different colour tracers into each eye. dLGN, dorsal lateral geniculate nucleus; OC, optic chiasm; ON, optic nerve; MTN, medial terminal nucleus; SC, superior colliculus. Scale bar: 300 µm. C. Mediolateral view of an LSFM-acquired 3D image stack from the whole brain of a mouse injected with different colour tracers into each eye. dLGN, dorsal lateral geniculate nucleus; MTN, medial terminal nucleus; ON, optic nerve; SC, superior colliculus; SCN, suprachiasmatic nucleus. Scale bar: 300 µm.

