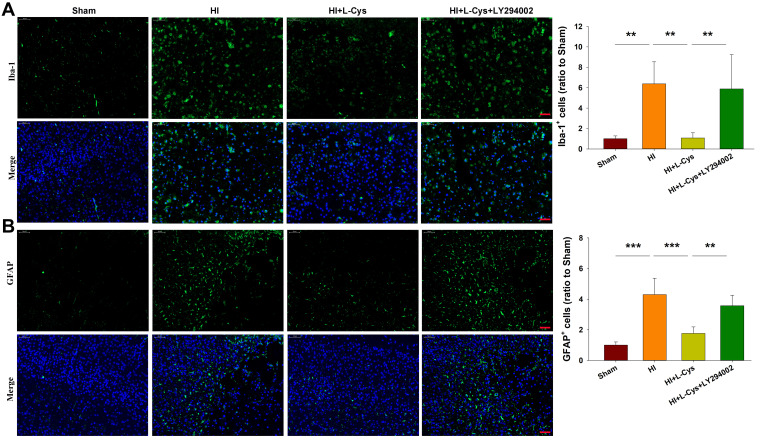
Figure 6.
L-Cysteine treatment suppresses HI-induced glia activation through the Akt pathway. Representative photographs indicating quantified numbers of cells within the right cortex at 72 h post-HI for (A) Iba-1 and (B) GFAP staining (Scale bar = 50 μm; N=4/group). Values represent the mean ± SD, **p < 0.01, ***p < 0.001 according to ANOVA.

