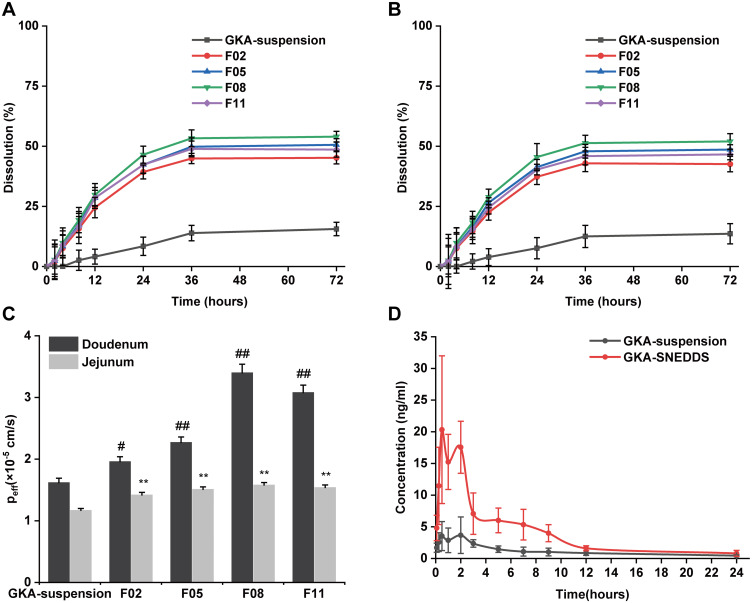
Figure 2.
Dissolution profiles of GKA-SNEDDS and GKA-suspension in (A) Simulated gastric fluid (pH 1.2). (B) Simulated intestinal fluid (pH 6.8). (C) The effective permeability coefficient (Peff) of GKA-SNEDDS in rats’ duodenum and jejunum by single-pass intestinal perfusion model. Each value represents the mean ± SD (n = 3). #p < 0.05 and ##p < 0.01 as compared to GKA- suspension group in duodenum, **p < 0.01 as compared to GKA-suspension group in jejunum. (D) Plasma concentration–time profiles of rats after oral administration of GKA-SNEDDS and GKA-suspension.

